
MILLIMAN RESEARCH REPORT
Analysis of life insurers’ solvency
and financial condition reports
year-end 2022
European and UK life insurers
September 2023
Sam Burgess
Neil Christy, FIA, CERA
Isabel Stansfield
MILLIMAN RESEARCH REPORT
Table of contents
INTRODUCTION ..................................................................................................................................................... 1
EUROPEAN MARKET COVERAGE .................................................................................................................. 1
UNDERLYING DATA ......................................................................................................................................... 2
EIOPA REVIEW OF SOLVENCY II .................................................................................................................... 3
UK REVIEW OF SOLVENCY II .......................................................................................................................... 3
SECTION 1: ANALYSIS OF EUROPEAN LIFE INSURERS ................................................................................. 5
ANALYSIS OF BALANCE SHEET ......................................................................................................................... 5
ASSETS ............................................................................................................................................................. 5
LIABILITIES ....................................................................................................................................................... 6
REINSURANCE ................................................................................................................................................. 7
ANALYSIS OF PREMIUMS, CLAIMS AND EXPENSES ....................................................................................... 9
GROSS WRITTEN PREMIUMS ......................................................................................................................... 9
INCURRED CLAIMS ........................................................................................................................................ 10
EXPENSES ...................................................................................................................................................... 12
ANALYSIS OF OWN FUNDS ............................................................................................................................... 12
ANALYSIS OF SOLVENCY COVERAGE ............................................................................................................ 13
ANALYSIS OF SCR ............................................................................................................................................. 18
LONG-TERM GUARANTEE MEASURES ........................................................................................................... 20
CONCLUSION ...................................................................................................................................................... 23
SECTION 2: ANALYSIS OF UK LIFE INSURERS ............................................................................................... 24
UK MARKET COVERAGE ............................................................................................................................... 24
ANALYSIS OF BALANCE SHEET ....................................................................................................................... 24
ASSETS ........................................................................................................................................................... 24
LIABILITIES ..................................................................................................................................................... 25
REINSURANCE ............................................................................................................................................... 27
ANALYSIS OF PREMIUMS, CLAIMS AND EXPENSES ..................................................................................... 28
GROSS WRITTEN PREMIUMS ....................................................................................................................... 28
INCURRED CLAIMS ........................................................................................................................................ 30
EXPENSES ...................................................................................................................................................... 31
ANALYSIS OF OWN FUNDS ............................................................................................................................... 31
ANALYSIS OF SOLVENCY COVERAGE ............................................................................................................ 34
ANALYSIS OF SCR ............................................................................................................................................. 39
ANALYSIS OF MCR ............................................................................................................................................. 41
LONG-TERM GUARANTEE MEASURES ........................................................................................................... 42
CONCLUSION ...................................................................................................................................................... 44
APPENDIX 1: UK LIFE COMPANIES INCLUDED IN THE ANALYSIS ............................................................... 45

MILLIMAN RESEARCH REPORT
Analysis of life insurers’ solvency and 1 September 2023
financial condition reports year-end 2022
Introduction
This report focuses on the solvency and financial condition reports (SFCRs) published in 2023 which refer to
year-end 2022.
1
The SFCRs contain a significant amount of information on each of the insurance companies,
including details on business performance, risk profile, balance sheet and capital position, amongst other things.
Insurers are also required to publish a great deal of quantitative information in the public quantitative reporting
templates (QRTs) included within the SFCRs.
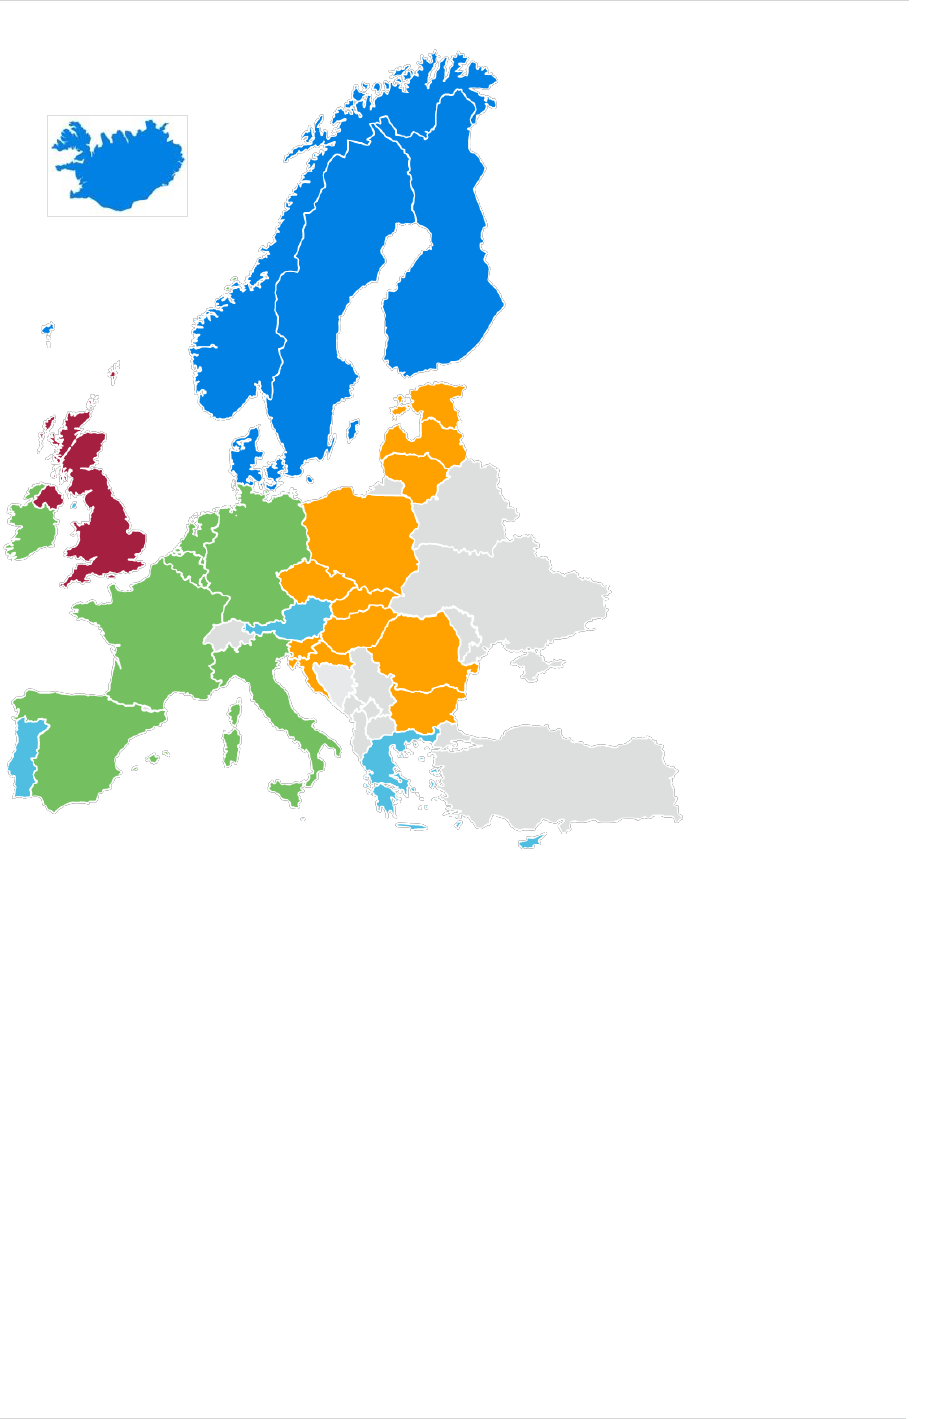
EUROPEAN MARKET COVERAGE
Our analysis of the European life insurance market covers 675 companies from 31 countries and 3 territories,
representing approximately £686 billion (€774 billion)
2
of gross written premium (GWP) and approximately £6.662
trillion (€7.514 trillion) of gross technical provisions (TPs). This represents a 2% decrease in the number of
companies and a 14% decrease in gross TPs relative to our year-end 2021 report on the SFCRs of life insurers.
The analysis does also represent a 5% decrease in the level of GWP relative to our previous report. This
suggests that overall sales of life insurance were lower in 2022 when compared to 2021. This is supported by
data published by the European Insurance and Occupational Pensions Authority (EIOPA) and is likely driven
primarily by the uncertain economic and geopolitical landscape.
The countries and territories included in the analysis are as follows, with some countries grouped into broad territories:
Austria (AT) ROE
Belgium (BE)
Bulgaria (BG) CEE
Croatia (HR) CEE
Cyprus (CY) ROE
Czechia (CZ) CEE
Denmark (DK) NOR
Estonia (EE) CEE
Finland (FI) NOR
France (FR)
Germany (DE)
Gibraltar (GI) ROE
Greece (EL) ROE
Guernsey (GG) ROE
Hungary (HU) CEE
Iceland (IS) NOR
Ireland (IE)
Isle of Man (IM) ROE
Italy (IT)
Latvia (LV) CEE
Liechtenstein (LI) ROE
Lithuania (LT) CEE
Luxembourg (LU)
Malta (MT) ROE
Netherlands (NL)
Norway (NO) NOR
Poland (PL) CEE
Portugal (PT) ROE
Romania (RO) CEE
Slovakia (SK) CEE
Slovenia (SI) CEE
Spain (ES)
Sweden (SE) NOR
United Kingdom (UK)
NOR – countries included in the Nordics category
CEE – countries included in the Central and Eastern Europe category
ROE – countries included in the Rest of Europe category
Our analysis is based on a sample of insurers that are primarily focused on selling life insurance business, and
as a result, some composite companies have been excluded from the analysis. Reinsurers have been included in
the analysis where their business has been deemed to be predominantly life reinsurance.
The charts and results in this report focus on nine of the largest European life insurance markets by the total
volume of TPs. The top nine markets selected cover approximately 86% of the total European life insurance
market by volume of TPs. The remainder of the nations are split into three categories: the Nordics (NOR), Central
and Eastern Europe (CEE), and the Rest of Europe (ROE). NOR and CEE are well-defined geopolitical
groupings whilst ROE includes the remaining nations and territories not captured within the other categories used
in our analysis.
Figure 1 shows the geographical coverage of this report. The UK is highlighted in red and the remaining eight
large European markets are shown in green. The remaining categories are shown as dark blue for the NOR,
orange for CEE and light blue for the ROE.
1
These SFCRs are referred to as the year-end 2022 SFCRs throughout this report as the reporting date for most companies included in the samples
is 31 December 2022. There are a small number of companies included in the sample which had a reporting date other than 31 December 2022.
2
GBP:EUR exchange rate of 1:1.13 for year-end 2022. An exchange rate of 1.19 is used for year-end 2021 figures. These figures are rounded to
three significant figures.
MILLIMAN RESEARCH REPORT
Analysis of life insurers’ solvency and 2 September 2023
financial condition reports year-end 2022
FIGURE 1: EUROPEAN COUNTRIES INCLUDED IN THE ANALYSIS
UNDERLYING DATA
The analysis underlying this report focuses on the quantitative information contained in the public QRTs. Where
relevant, we have also studied the SFCRs to gain additional insights into some companies, if they displayed
characteristics which differed from market norms. Our focus is on solo entities rather than groups.
In carrying out our analysis and producing this research report, we relied on the data provided in the SFCRs and
QRTs of our sample companies. We have not audited or verified this data or other information. If the underlying data
or information is inaccurate or incomplete, the results of our analysis may likewise be inaccurate or incomplete.
We performed a limited review of the data used directly in our analysis for reasonableness and consistency and
have not found material defects in the data. It should be noted that in some cases errors were spotted in the
underlying data. We have made minor adjustments to the data to correct known errors such as inconsistencies
between QRTs to better inform our analysis. However, we have not made any material changes to the underlying
data. We have not made any changes to the data to reflect additional information or changes following the
reporting date.
This research report is intended solely for informational purposes and presents information of a general nature.
The underlying data and analysis have been reviewed on this basis. This report is not intended to guide or
determine any specific individual situation, and persons should consult qualified professionals before taking
specific actions.
The data analysed in this report has been sourced from Solvency II Wire Data and companies’ disclosed SFCRs.
The data is available via subscription from: https://solvencyiiwiredata.com/about.
Our analysis of the
European life insurance
market covers:
675 COMPANIES
31 COUNTRIES
and three territories
£686 BILLION
in gross written premiums
£6.662 TRILLION
of gross technical provisions

MILLIMAN RESEARCH REPORT
Analysis of life insurers’ solvency and 3 September 2023
financial condition reports year-end 2022
EIOPA REVIEW OF SOLVENCY II
In 2020, EIOPA published its opinion on the Solvency II Review. Following this, in 2021, the European
Commission (EC) announced its proposals to reform Solvency II taking advice from the recommendations
provided by EIOPA. As part of the legislative procedure, the European Parliament appointed Markus Ferber as a
rapporteur for the file who tabled his draft report.
After more than a year of negotiations, in July 2023, the European Parliament’s Committee on Economic and
Financial Affairs (Econ) approved the proposed amendments to the directive with 55 votes in favour of the
rapporteur’s draft report and 3 against. The rapporteur’s report is considered ‘a step in the right direction’ but
negotiations are still ongoing.
One of the areas under review was the current supervisory reporting and public disclosure requirements,
including the QRTs and the SFCR. These changes will have an impact on future published SFCRs and on the
data contained within them. The proposals accepted by Parliament are broadly consistent with those put forward
by the EC and EIOPA and are intended to ensure that the SFCR remains fit for purpose by all stakeholders which
use the document. Some of the highlights from the proposals in relation to the SFCR are:
To consider the needs of different stakeholders and the different levels of expertise of professional and non-
professional readers, by splitting the SFCR into two sections that are addressed to:
− Policyholders – This section must be short and easy to read, focusing on areas of Solvency II that are
relevant to policyholders. It should include a brief description of the business and performance of the
undertaking as well as the risk profile, including in relation to sustainability risks.
− Non-policyholders – This section should broadly follow the current form of the SFCR and should target
professional readers. It should contain less information than currently provided in some areas, and more
detailed, structured, harmonised information in other areas.
An extension to the reporting deadline for solo SFCRs by four weeks from 14 weeks to 18 weeks, and for the
group SFCRs by four weeks from 20 weeks to 24 weeks.
Changes to the external audit requirements of the SFCR, such that as a minimum the Solvency II balance sheet is
subject to external auditing by a qualified auditor with individual member states able to require the audit of
additional items. Low-risk profile insurers are exempt from this requirement on proportionality grounds.
Additional information included within the SFCR on topics such as sustainability risks; environmental, social
and governance (ESG) factors; and climate change issues. There will also be more explicit reporting of the
impact of long-term guarantee measures (LTGMs).
The publication of a full SFCR will not be required by low-risk profile insurers each year and instead such
firms will report a full SFCR every three years and a simplified disclosure for the other years.
Any changes to the European Solvency II regulations are not applicable to the UK and consequently may not be
adopted by the Prudential Regulation Authority (PRA) as part of the UK Solvency II regime. Therefore, diversions
between the two regimes are likely to arise.
Member states shall adopt the reforms by 30 June 2025, and they should apply to insurers from 1 January 2026.
However, these dates are not yet certain because the duration of the implementation period is part of the
continued negotiations between the rapporteur and Parliament.
UK REVIEW OF SOLVENCY II
Since 1 January 2021, the UK insurance market has only been regulated by the PRA and the Financial Conduct
Authority (FCA) and is no longer required to follow EU regulations. Since the UK’s exit from the European Union,
the PRA has had the ability to make changes and design its own insurance regulatory regime.
This has led to some diversions between the European and UK Solvency II regimes, with further diversions likely
to arise in the future between the UK and European markets adopting different amendments to their regimes.

MILLIMAN RESEARCH REPORT
Analysis of life insurers’ solvency and 4 September 2023
financial condition reports year-end 2022
His Majesty’s Treasury (HMT) set out the UK Government’s final reform package
3
in November 2022 and
following this a policy statement
4
in December 2022 outlining an implementation plan.
The reform focuses on a few key areas:
Risk margin – with a view to reducing the risk margin for long-term life insurers by around 65%
Matching adjustment – including a reassessment of the fundamental spread
Increasing investment flexibility – increasing the ability of firms to invest in long-term assets
Reducing reporting and administrative burdens
As part of its plans to legislate directly to implement certain parts of the Solvency II reform package, HMT set out
its approach in draft statutory instruments
5
, which brings forward reforms to the risk margin and certain aspects of
the matching adjustment (MA).
Those parts of the reform package not contained in legislation are intended to be implemented through changes
to PRA rules and other policy material. The PRA is currently consulting on its approach in two tranches:
Consultation Paper (CP) 12/23
6
, which sets out the majority of the PRA’s reform proposals, focusses on
simplification, improving flexibility and encouraging entry.
A second consultation planned for September 2023, which will cover reform proposals for life insurers
relating to investment flexibility and the MA.
Some of the highlights
7
from CP12/23 include:
A modified cost-of-capital approach to setting risk margin (RM) was preferred with the cost-of-capital rate
being set to 4% (compared to the current 6%). The changes set out also include the introduction of a lambda
factor
8
of 0.9 with a floor of 0.25.
The transitional measure on technical provisions (TMTP) will be calculated using a new default method,
derived solely using figures produced under Solvency II and therefore removing the need to perform
calculations under a Solvency I basis.
Streaming the requirements which firms (and groups) must meet for permission to use an internal model.
At the time of writing there have been no amendments to the UK Solvency II regime as a result of the HMT
review, although there have been some changes to the UK Solvency II regime relating to the published yield
curves and symmetric adjustment as well as minor changes to the QRTs.
9
Subject to consultation responses, the
PRA expects to issue final policy in relation to most of the proposals nearing the end of 2023. There still remains
uncertainty over what the future UK insurance regulatory landscape will look like, and the impact any changes
may have on UK insurers.
3
Review of Solvency II: consultation – response. (November 2022). HMT. Retrieved on September 7, 2023, from
https://assets.publishing.service.gov.uk/government/uploads/system/uploads/attachment_data/file/1118359/Consultation_Response_-
_Review_of_Solvency_II_.pdf.
4
Building a smarter financial services framework for the UK: Policy Statement. (December 2022). HMT. Retrieved on September 7, 2023, from .
https://assets.publishing.service.gov.uk/government/uploads/system/uploads/attachment_data/file/1122734/Building_a_smarter_financial_servic
es_framework_for_the_UK_.pdf.
5
Draft insurance and reinsurance undertakings regulations. (June 2023). HMT. Retrieved on September 7, 2023, from.
https://www.gov.uk/government/publications/draft-insurance-and-reinsurance-undertakings-prudential-requirements-regulations
6
CP12/23 – Review of Solvency II: adapting to the UK insurance market. PRA. Retrieved on September 7, 2023, from
https://www.bankofengland.co.uk/prudential-regulation/publication/2023/june/review-of-solvency-ii-adapting-to-the-uk-insurance-market
7
Patel, D., Ginghina, F., & Walker, S. (2023, July 7). CP12/23 – Review of Solvency II: adapting to the UK insurance market. Milliman. Retrieved
on September 7, 2023, from https://uk.milliman.com/en-gb/insight/cp-12-23-review-solvency-ii-uk-insurance.
8
The lambda factor is a method of tapering the risks projected under the risk margin calculation. This method has been assessed by EIOPA and
the PRA with options for the potential parameters which will define this approach under discussion. See the Milliman paper on the PRA’s
CP12/23 for more details on this approach.
9
Christy, N. (2022, January 3). PS29/21 – review of Solvency II: reporting (phase 1). Milliman. Retrieved on September 7, 2023, from
https://uk.milliman.com/en-GB/insight/ps2921-review-of-solvency-ii-reporting-phase-1.
MILLIMAN RESEARCH REPORT
Analysis of life insurers’ solvency and 5 September 2023
financial condition reports year-end 2022
Section 1: Analysis of European life insurers
Analysis of balance sheet
ASSETS
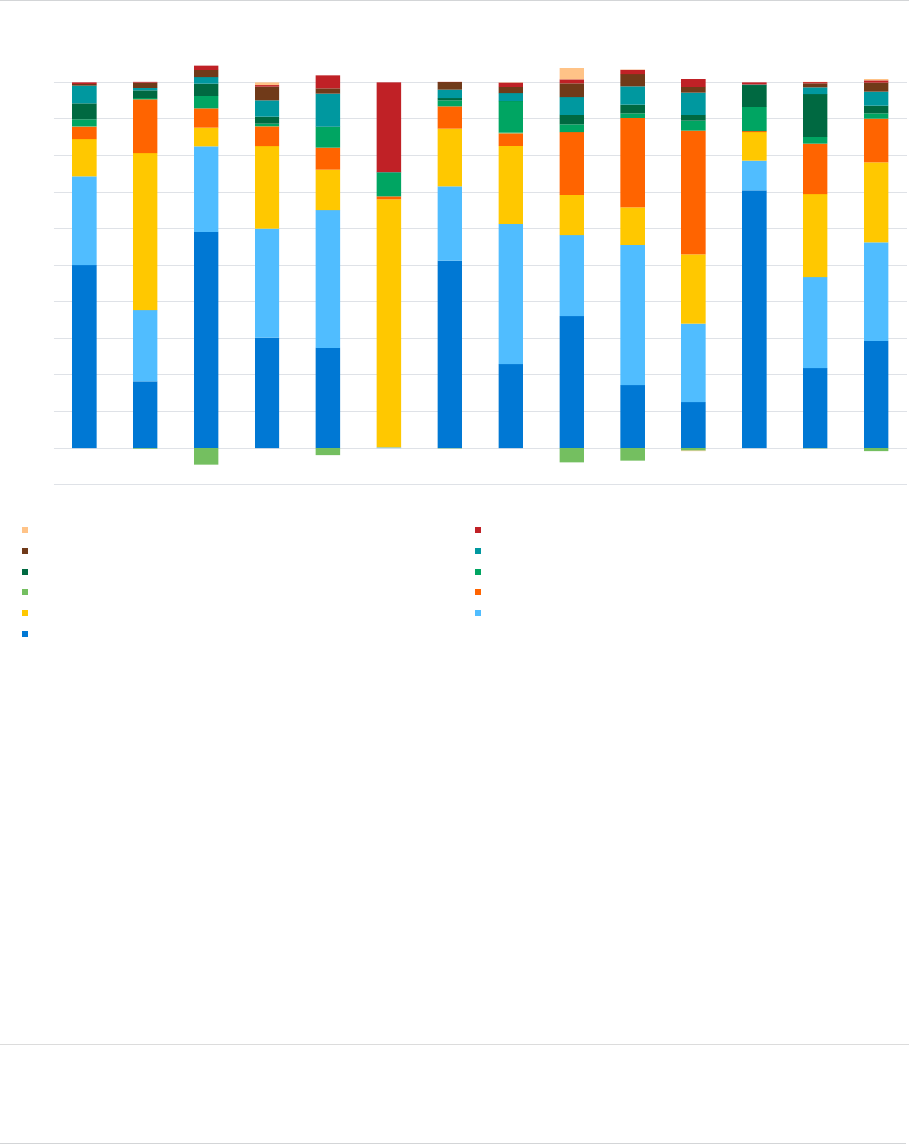
Figure 2 shows the split of financial investments held by life insurers across European countries at year-end
2022, with the total figure for all countries and territories in our analysis represented in the final bar on the right-
hand side of the chart, labelled as ‘Europe.’ This chart comprises financial investments classified as ‘Investments
(Other than Assets Held for Index-linked and Unit-linked Contracts)’
10
and 'Cash and cash equivalents' on the
Solvency II balance sheet.
11
FIGURE 2: SPLIT OF NON-LINKED ASSETS ACROSS EUROPE
In general, investments in
government bonds and corporate
bonds make up the majority of
financial investments on European
life insurers’ balance sheets.
In aggregate, across our sample of
European insurers, government
bonds and corporate bonds make up 29% and 27% of total financial investments, respectively. These proportions
are similar to those observed at year-end 2021 with a slight decrease in the proportion of government bonds of
4%. Government bonds continue to make up a significant proportion of investments in most of the countries,
including approximately 60% of total investments in Spain as well as over 70% in some countries in CEE
(Hungary, Poland and Bulgaria). However, the proportion of total investments held in government bonds did
decrease for some countries by over 10%. This included Liechtenstein and Portugal who reported an offsetting
increase in cash and collective investments respectively.
10
‘Assets held for Index-linked and Unit-linked Contracts’ are excluded as this category provides limited insight into what underlying assets categories
the investments are held in. In some jurisdictions this category is significant and leads to the remainder of the bar being quite difficult to read.
11
The liability side of derivatives is also included to give the net derivative position.
-10%
0%
10%
20%
30%
40%
50%
60%
70%
80%
90%
100%
BE DE ES FR IE IM IT LU NL UK NOR CEE ROE Europe
OTHER INVESTMENTS DEPOSITS OTHER THAN CASH EQUIVALENTS
OTHER BONDS EQUITY
PROPERTY CASH AND CASH EQUIVALENTS
NET DERIVATIVES HOLDINGS IN RELATED UNDERTAKINGS, INCLUDING PARTICIPATIONS
COLLECTIVE INVESTMENTS UNDERTAKINGS CORPORATE BONDS
GOVERNMENT BONDS
GOVERNMENT AND CORPORATE BONDS
account for 29% and 27%
of all financial investments, respectively.
MILLIMAN RESEARCH REPORT
Analysis of life insurers’ solvency and 6 September 2023
financial condition reports year-end 2022
Investments in collective investment schemes is the next largest category, accounting for a further 22% of total
financial investments. In particular, the level of holdings is due to large volumes in Germany (43%) as well
accounting for 22% of holdings in France and 19% in the NOR. It is worth noting that these schemes are also
likely to invest primarily in bonds.
Holdings in related undertakings, including participations, make up only 12% of total European financial investments,
but make up a much higher percentage within the UK and the NOR (24% and 34%, respectively). The NOR
percentage is driven by large holdings in related undertakings in the Danish market, accounting for 34% of all assets in
Denmark. Detailed analysis of the asset holdings in the UK is included in Section 2 of this report.
The derivatives shown in Figure 2 represent the net derivative position. Based on the companies in our sample, a
few have net negative positions, meaning that on average the value of derivative liabilities is greater than the
value of derivative assets on the Solvency II balance sheet. This is particularly prevalent in Spain where the
largest net negative derivative position for a firm is in respect of interest rate hedging.
The remaining asset classes such as cash and cash equivalents, equity, property, and other smaller asset
classes only total around 10% of all assets held by European life insurers. There are some regions in our
analysis which do make significant use of some of these asset classes including 33% of all assets in
Liechtensteiner life insurers being invested in cash and cash equivalents, whilst Isle of Man holds 25% of all its
investments in deposits others than cash equivalents.
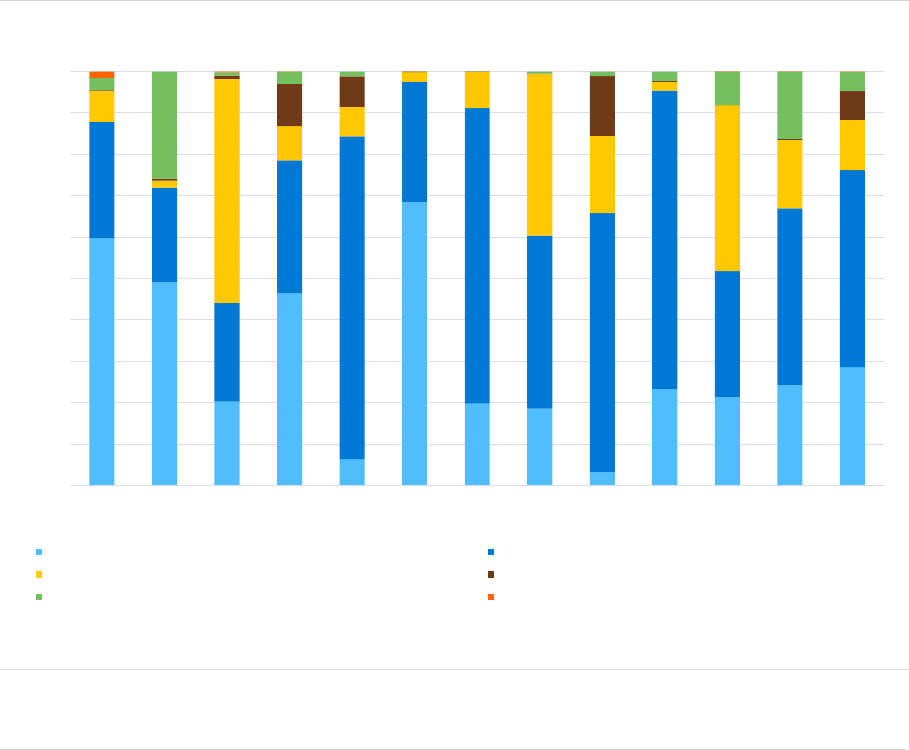
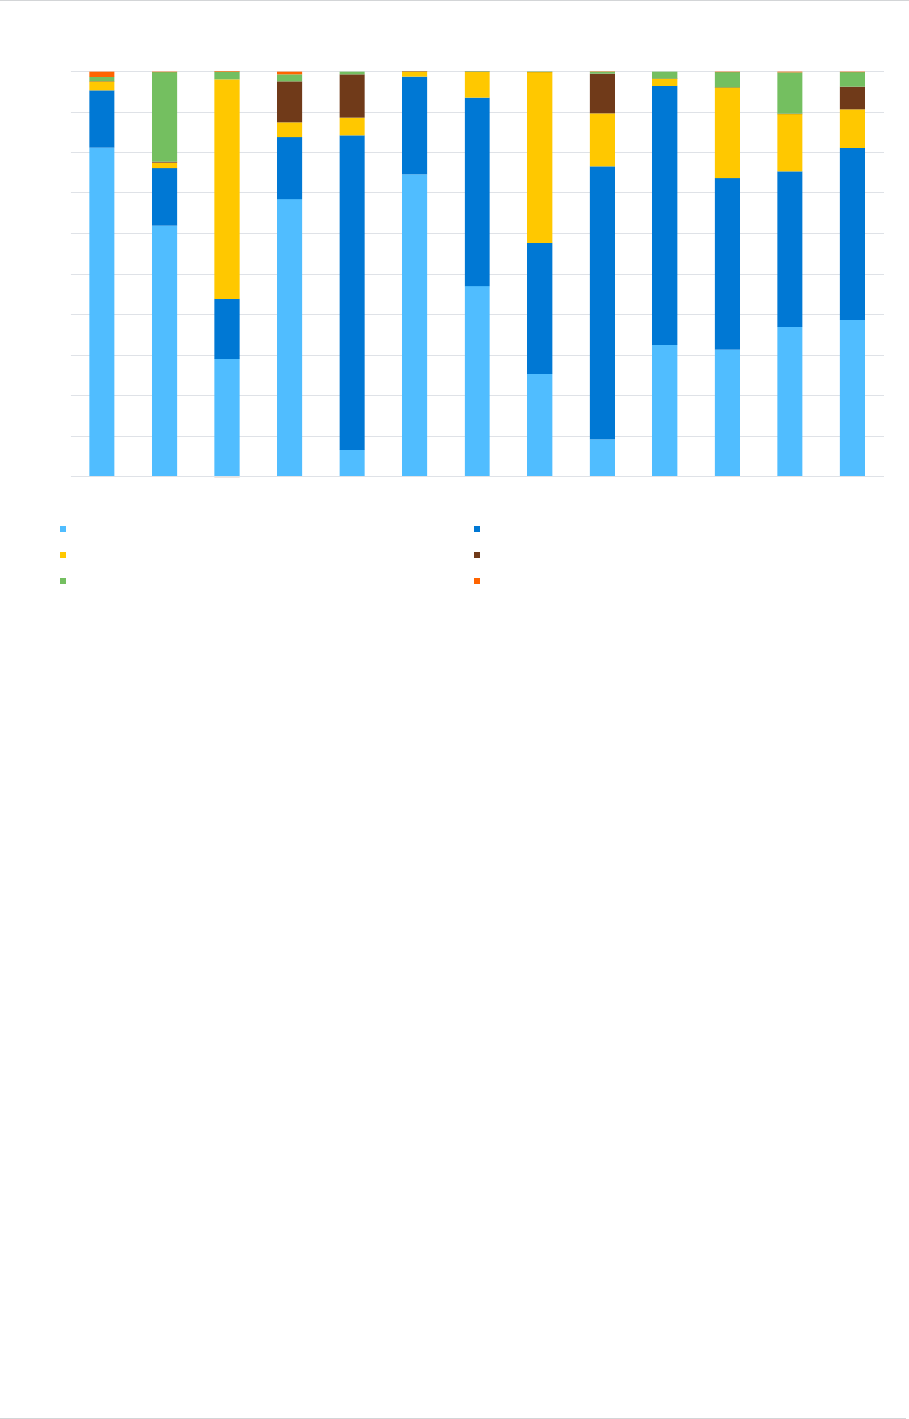
LIABILITIES
Figure 3 shows the split of TPs by line of business held by life insurers across European countries at year-end 2022.
FIGURE 3: SPLIT OF TECHNICAL PROVISIONS BY LINE OF BUSINESS ACROSS EUROPE
The TPs for many large European insurance markets including the Belgian, French, German and Italian markets
are dominated by ‘Insurance with Profit Participation,’ whereas in the markets of Ireland, Luxembourg and the UK
the TPs are predominantly in respect of ‘Index-linked (IL) and Unit-linked (UL) Insurance’ business. The markets
in the NOR, CEE and ROE also show similar dominance by these two lines of business. The dominant lines of
business in each of the nine largest markets as well as the NOR, CEE and ROE have remained unchanged
relative to year-end 2021 results.
0%
10%
20%
30%
40%
50%
60%
70%
80%
90%
100%
BE DE ES FR IE IM IT LU NL UK NOR CEE ROE Europe
INSURANCE WITH PROFIT PARTICIPATION IL AND UL INSURANCE
OTHER LIFE INSURANCE ANNUITIES STEMMING FROM NON-LIFE INSURANCE
ACCEPTED REINSURANCE
MILLIMAN RESEARCH REPORT
Analysis of life insurers’ solvency and 7 September 2023
financial condition reports year-end 2022
As a result of this dominance, these two lines of business
represent the largest proportion of TPs across Europe on
average. In aggregate, across our sample of European
countries, ‘Insurance with Profit Participation’ makes up just
under half of the total TPs for life insurers (44%). ‘IL and UL
Insurance’ makes up the second-largest portion of TPs (43%).
‘Other Life Insurance’ (8%), which includes products such
as non-profit annuities and traditional protection business,
has the largest share of the market in only two of the
individual countries considered in our analysis: the
Netherlands and Spain.
‘Accepted Reinsurance’ (4%) makes up the bulk of the remaining TPs, whilst ‘Annuities Stemming from Non-Life
Insurance Contracts’ accounts for just over 0.02% of total TPs.
TPs in respect of ‘Health Similar to Life Techniques’ (HSLT) business have been excluded from Figure 3, as
these lines of business are very small on average across the sample of companies considered in the analysis.
Since the previous set of SFCRs was published, the market share of ‘Insurance with Profit Participation’ has
reduced by two percentage points whilst ‘Other Life Insurance’ has reduced by one percentage point. These
reductions have been met by an increase in the proportion of ‘IL and UL Insurance’ technical provisions of three
percentage points. This suggests a shift away from selling new ‘Insurance with Profit Participation’ and ‘Other Life
Insurance’ products towards ‘IL and UL Insurance’ products. This is a trend we have observed over the past few
years of our analysis, and it will be interesting to see if the proportion of ‘IL and UL Insurance’ overtakes that of
‘Insurance with Profit Participation’ in the future as this gap has been narrowing over the years of our analysis.
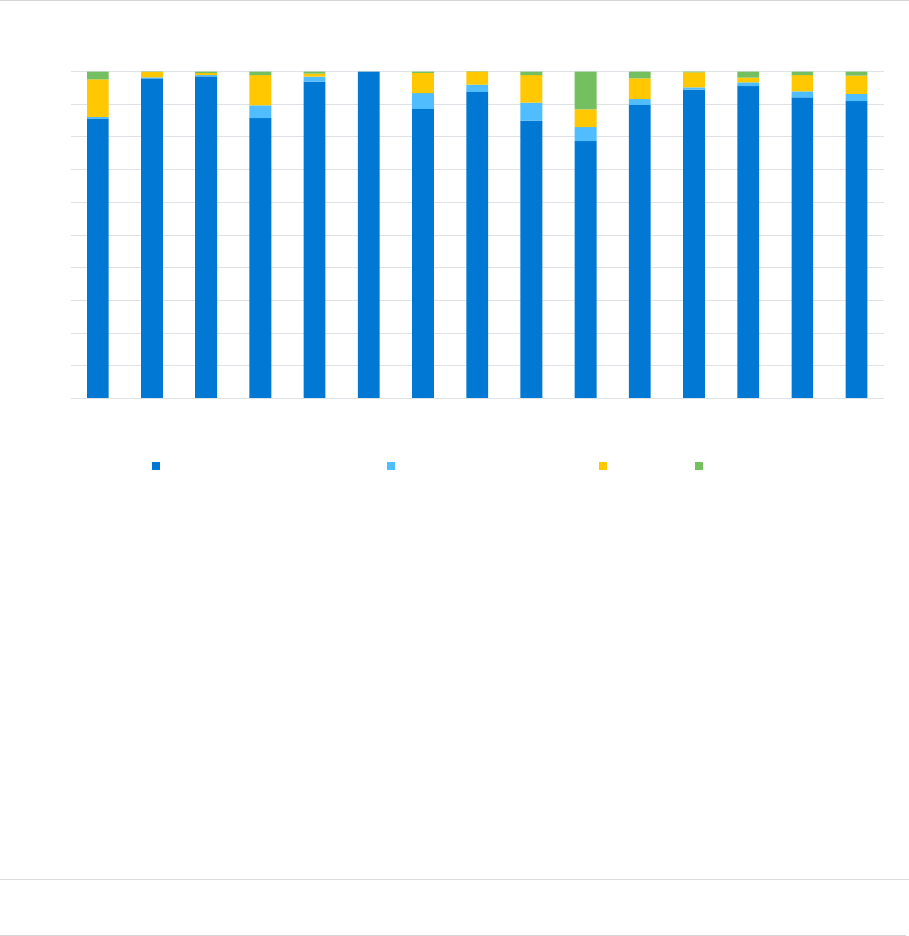
REINSURANCE
Figure 4 shows how the use of reinsurance varies across European countries at year-end 2022. The ceded rates
represent the difference in the best estimate liability (BEL) gross and net of reinsurance recoverables.
FIGURE 4: ANALYSIS OF USE OF REINSURANCE ACROSS EUROPE
0%
10%
20%
30%
40%
50%
60%
70%
80%
90%
100%
BE DE ES FR IE IM IT LU NL UK NOR CEE ROE Europe
RETAINED CEDED
44% OF TOTAL TPs
for European life insurers are
‘Insurance with
Profit Participation.’
MILLIMAN RESEARCH REPORT
Analysis of life insurers’ solvency and 8 September 2023
financial condition reports year-end 2022
On average, about 5.3% of the BEL is reinsured across Europe based on the companies in our sample which
also include reinsurers. This varies by country, with Luxembourg (15.0% of BEL reinsured), UK (12.3%) and
Ireland (10.4%) being the most reliant on reinsurance of the individual countries analysed. Overall, the
percentage of the BEL which is reinsured has decreased marginally since the last set of SFCRs were published,
with 5.5% of the BEL reinsured across European life insurers at year-end 2021. It is important to note that the
impact of reinsurance on the BEL may not always provide insight on the full impact of reinsurance on the
Solvency II balance sheet. For example, a longevity swap could potentially lead to a slight increase in the BEL
but will be offset by a larger impact on the solvency capital requirement (SCR) and risk margin.
Figure 5 shows the proportion of BEL for each line of business which is ceded to reinsurers by European life insurers at
year-end 2022.
FIGURE 5: PERCENTAGE OF TECHNICAL PROVISIONS WITH REINSURANCE
The line of business with the highest ceded level of reinsurance is ‘Other Life Insurance’ at 10.6%. This is
considerably higher than the second-largest ceded percentage, which is 'IL and UL Insurance’ at 6.6%.
‘Insurance with Profit Participation’ and ‘Accepted Reinsurance’ reinsure 3.4% and 2.7%, respectively.
Overall, the European life insurance industry has life reinsurance recoverables of £347 billion (€392 billion)
across all life TPs in our sample. The results suggest a decrease in the proportion of life insurers’ BEL reinsured
over the year. In particular:
There was a 17% decrease in life reinsurance recoverables, which was bigger than the 15% decrease in the
GBP amount of life TPs over the year.
Considering the EUR figures, the life reinsurance recoverables have decreased from €498 billion to €392
billion, representing a decrease of 21%, whilst the life TPs have decreased from €9,237 billion to €7,514
billion, representing a decrease of 19%.
This result could be explained by the increases in long-term interest rates over the year.
3.4%
6.6%
10.6%
2.7%
5.3%
0.0%
2.0%
4.0%
6.0%
8.0%
10.0%
12.0%
INSURANCE WITH
PROFIT PARTICIPATION
IL AND UL INSURANCE OTHER LIFE
INSURANCE
ACCEPTED
REINSURANCE
TOTAL
On average,
of the BEL of life insurers
is
REINSURED ACROSS EUROPE
5.3%
MILLIMAN RESEARCH REPORT
Analysis of life insurers’ solvency and 9 September 2023
financial condition reports year-end 2022
Analysis of premiums, claims and expenses
GROSS WRITTEN PREMIUMS
When considering premium volumes related to new business written during 2022, we first looked at the figures
quoted by EIOPA in their published insurance statistics.
12
Comparing the life insurance GWP figures quoted by
EIOPA in 2022 (£572 billion/€646 billion) to those for 2021 (£594 billion/€707 billion)
13
we see that there has
been a decrease in both euro (EUR) and British pound sterling (GBP) denominated premium levels relative to
last year. The movement in EUR is larger due to the weakening of GBP against EUR, with the exchange rate
GBP:EUR decreasing from 1.19 to 1.13 over the year. Comparing the EIOPA figures to our sample shows that
around 82% of all life insurance GWP reported by EIOPA in 2022 is captured within our sample. This is a small
reduction when compared to our year-end 2021 analysis which covered around 84% of GWP reported by EIOPA.
It is perhaps unsurprising that the overall volume of GWP decreased in 2022 given the geopolitical tensions and
uncertain economic environment despite companies and markets recovering from the COVID-19 pandemic.
However, some markets such as Denmark and Spain saw an overall increase in the life insurance GWP
compared to 2021 in our analysis:
In Spain, the increase is driven predominantly by the increase in GWP of one large life insurer who sold
larger volumes of ‘IL and UL Insurance’ and ‘Other Life Insurance’ compared to the previous year. The
increase was also driven by one firm who was included in our analysis at year-end 2022 but not for year-end
2021 due to QRT data being unavailable at the time of drafting last year’s report.
In Denmark, this increase is driven predominantly by two firms which were included in our analysis at year-end
2022 but not for year-end 2021 due to missing QRT entries leading to us not being able to analyse these firms.
Figure 6 shows the split of GWP by line of business held by life insurers across European countries at year-end
2022 based on our analysis. GWP includes premiums payable on in-force business and on any new business
sales over the reporting period.
FIGURE 6: SPLIT OF GROSS WRITTEN PREMIUMS BY LINE OF BUSINESS ACROSS EUROPE
12
Insurance statistics. EIOPA. Retrieved on September 7, 2023, from https://www.eiopa.europa.eu/tools-and-data/insurance-statistics_en.
13
Note that due to the UK’s exit from the EU, EIOPA’s figures for 2021 and 2022 did not include information on the UK.
0%
10%
20%
30%
40%
50%
60%
70%
80%
90%
100%
BE DE ES FR IE IT LU NL UK NOR CEE ROE Europe
INSURANCE WITH PROFIT PARTICIPATION INDEX-LINKED AND UNIT-LINKED INSURANCE
OTHER LIFE INSURANCE LIFE AND HEALTH REINSURANCE
HEALTH INSURANCE ANNUITIES STEMMING FROM NON-LIFE INSURANCE CONTRACTS

MILLIMAN RESEARCH REPORT
Analysis of life insurers’ solvency and 10 September 2023
financial condition reports year-end 2022
The split of premium volumes by line of business is slightly different from the split of TPs shown in Figure 3. On
average across our entire sample, ‘IL and UL Insurance’ (48%) and ‘Insurance with Profit Participation’ (29%)
make up the largest portions of premium volumes. This contrasts with the split of TPs where ‘Insurance with
Profit Participation’ has the largest share of the market, closely followed by ‘IL and UL Insurance.’ This was also
noted in our previous report, where it was suggested that ‘IL and UL Insurance’ was likely to increase its share of
the market going forward due to higher premium volumes being sold in this category compared to ‘Insurance with
Profit Participation.’ This conclusion aligns with the decrease in the proportion of TPs categorised as ‘Insurance
with Profit Participation,’ and the increase in ‘IL and UL Insurance’ since year-end 2021.
When comparing to the year-end 2021 SFCRs, the proportion of GWP attributable to ‘Insurance with Profit
Participation’ has remained relatively stable at 29%, whilst there has been an overall decrease in the proportion
attributable to ‘IL and UL Insurance’ (50% at year-end 2021; 48% at year-end 2022). In our last few years of
reports, we noted that firms were promoting ‘IL and UL Insurance’ over ‘Insurance with Profit Participation’ due to
the sustained low interest rate environment and the effect this has on the ability to declare future bonuses.
Therefore, the rise in interest rates across Europe over the past year may explain at least some of the change in
trend. A decrease in the proportion of ‘IL and UL Insurance’ GWP and counteracting increase in the proportion of
‘Insurance with Profit Participation’ GWP is particularly apparent in NOR.
The Spanish market is an outlier when looking at the split of GWP, with ‘Other Life Insurance’ making up the
highest proportion in this country. The Netherlands also shows a high proportion of ‘Other Life Insurance.’ This is
consistent with the results seen in our TP analysis. ‘Other Life Insurance’ has been the dominant line of business
in Spain and the Netherlands in past years of our analysis and includes predominantly traditional insurance
products such as endowments, pure endowments, annuities and term life insurance where these have no profit
sharing or linked elements. It is only in the year-end 2022 SFCRs that we have observed the Netherlands having
a slightly higher proportion of ‘IL and UL Insurance’ GWP.
Overall, the breakdown for each of the markets remains relatively consistent when compared to our year-end
2021 analysis of SFCRs.
INCURRED CLAIMS
We conducted a similar analysis of claim volumes incurred for 2022 as that carried out for premiums. Comparing
the life insurance claim figures quoted by EIOPA in 2022 (£489 billion/€552 billion) to those for 2021 (£478
billion/€568 billion) we can see that there has been a slight increase in GBP-dominated claim levels but decrease
in euro-dominated claim levels. This differing movement in currency is again due to the weakening GBP against
EUR over the year.
This means that premiums have reduced whilst claims have increased on a GBP basis, and premiums have
reduced to a greater extent than claims on a euro basis, further highlighting a lack of growth in the industry over
the past year.
Figure 7 shows the split of incurred claims by line of business held by life insurers across Europe based on our
2022 sample, which covered around 85% of claims reported by EIOPA.
‘INDEX-LINKED AND UNIT-LINKED INSURANCE’
account for the largest volume of gross written premiums
48%
MILLIMAN RESEARCH REPORT
Analysis of life insurers’ solvency and 11 September 2023
financial condition reports year-end 2022
FIGURE 7: SPLIT OF CLAIMS INCURRED BY LINE OF BUSINESS ACROSS EUROPE
The split of claim volumes by line of business does show a similar pattern to the split of GWP shown in Figure 6,
with ‘IL and UL Insurance’ (42%) making up the largest portion of claim volumes across our entire sample.
However, this does display a smaller proportion to the 48% of GWP that is classed under this line of business.
This could provide evidence for the fact that the ‘IL and UL Insurance' market is growing in the long term with
new business being written despite the high interest rate environment we are currently experiencing. In contrast,
the proportions of claims incurred attributable to ‘Insurance with Profit Participation’ (39%) is higher than the 29%
of GWP indicating that ‘Insurance with Profit Participation’ business may be retracting, with claims on with-profit
business exceeding the premiums coming in due to less business being written than serviced.
This pattern was particularly prevalent in certain countries:
As mentioned previously, the French market is dominated by ‘Insurance with Profit Participation’ both in
terms of liabilities and premiums. However, 32% of GWP were classified as ‘IL and UL Insurance,’ whereas
this business line only made up 15% of claims. Comparatively, 46% of GWP were classified as ‘Insurance
with Profit Participation’ compared to the much higher 69% of claims falling under this title. This indicates
that with-profit business is contributing a larger proportion of claims in France than the premiums which it
provides. This may suggest a change in France to move towards ‘IL and UL Insurance.’
Luxembourg classifies 71% of GWP as ‘IL and UL Insurance,’ whereas this business line only makes up
47% of incurred claims. Comparatively, 20% of GWP were classified as ‘Insurance with Profit Participation’
compared to the much higher 47% of claims falling under this business line. This indicates that firms within
Luxembourg are continuing to make a move towards writing more ‘IL and UL insurance’ business as sales
continue to fall for ‘Insurance with Profit Participation’ business.
The proportions of claims incurred attributable to other lines of business are, meanwhile, relatively similar to the
proportions of GWP. The proportions of claims incurred under ‘Other Life Insurance,’ ‘Life and Health
Reinsurance’ and ‘Health Insurance’ were 9%, 6% and 4%, respectively, whilst the equivalent GWP proportions
were 12%, 7% and 5%. The proportions of both claims incurred and GWP under ‘Annuities’ were less than 0.2%.
0%
10%
20%
30%
40%
50%
60%
70%
80%
90%
100%
BE DE ES FR IE IT LU NL UK NOR CEE ROE Europe
INSURANCE WITH PROFIT PARTICIPATION INDEX-LINKED AND UNIT-LINKED INSURANCE
OTHER LIFE INSURANCE LIFE AND HEALTH REINSURANCE
HEALTH INSURANCE ANNUITIES STEMMING FROM NON-LIFE INSURANCE CONTRACTS
MILLIMAN RESEARCH REPORT
Analysis of life insurers’ solvency and 12 September 2023
financial condition reports year-end 2022
EXPENSES
When considering the expenses incurred by the firms within our sample, we found the absolute amount increased over
the year from £66.0 billion in 2021 to £66.5 billion in 2022, representing a small increase of approximately 1%. This is
despite total assets falling by around 11% since year-end 2021 and a reduction in our overall sample size. This result is
likely driven by the high inflation environment leading to increased expenses for most insurers. These movements
combined resulted in an increase to expenses as a percentage of assets from 0.7% to 0.8%.
For countries in our sample, expenses as a percentage of assets (expense ratio) range from 0.3% to 10.2%.
demonstrating that on average firms do not tend to incur expenses of more than 10% of the assets they hold. The
country with the largest proportion of expenses to assets was Iceland hosting a ratio of 10.2%. Our sample for
Iceland only contains two firms with ratios of 10% and 11%, respectively. The CEE region also contained
countries with high average expenses compared to assets with a ratio of 4.4%. The firms with the largest
expense ratios tend to be the smallest companies as they are not benefitting from economies of scale.
In comparison, the largest markets and the Nordics managed to maintain low expenses ratios, with Denmark and
Norway having the lowest average level at 0.3%.
Analysis of own funds
Figure 8 shows the split of own funds across European countries at year-end 2022.
FIGURE 8: SPLIT OF OWN FUNDS ACROSS EUROPE
The majority of own funds (91%) held by EU
life insurers in our sample are classified as tier
1 unrestricted own funds. This is the highest
form of capital in terms of quality and loss
absorbency as defined under Solvency II.
Whilst the split of own funds varies by country,
in general the majority of European insurers
have a very high proportion of tier 1
unrestricted own funds, with all countries
reporting at least three quarters
14
of their own
funds as tier 1 unrestricted.
Tier 1 restricted own funds make up 2% of own funds on average across Europe. Tier 2 own funds make up 6%
of total own funds, and tier 3 own funds make up just 1% of total own funds on average.
14
The lowest proportion of tier 1 unrestricted own funds was observed in Norway (77%).
0%
10%
20%
30%
40%
50%
60%
70%
80%
90%
100%
BE DE ES FR IE IM IT LI LU NL UK NOR CEE ROE Europe
TIER 1 - UNRESTRICTED TIER 1 - RESTRICTED TIER 2 TIER 3
91% OF OWN FUNDS held by
European life insurers are
UNRESTRICTED TIER 1

MILLIMAN RESEARCH REPORT
Analysis of life insurers’ solvency and 13 September 2023
financial condition reports year-end 2022
Belgium and France have the highest proportion of tier 2 own funds when compared to other large European
countries, with tier 2 own funds accounting for 11% of total own funds in Belgium and 9% in France. The tier 2
own funds are primarily in respect of hybrid debt and subordinated loans in these markets.
Tier 3 own funds are held predominantly in the Netherlands, the UK and France, which together account for 79%
of all tier 3 own funds. Net deferred tax assets remain the main item categorised as tier 3 own funds in the Dutch
market, the large amount likely as a result of the combination of relative high interest guarantees given in the
past, combined with the long duration and tax rate. Approximately 80% of tier 3 own funds in the French market
is attributable to three firms which classify some of their subordinated liabilities as tier 3 own funds.
Although it cannot be seen individually on the chart, Norway is an outlier when it comes to the breakdown of own
funds by tier. Norwegian firms report 19% as tier 2, compared to the European average of 6%. Subordinated
liabilities are the major driver of the high levels of tier 2 own funds in Norway. In particular, Storebrand
Livsforsikring AS took out a subordinated loan of approximately £153 million in the fourth quarter of 2022, which
has been classified as tier 2 own funds to refinance another subordinated loan, as a result of early repayment.
There has been, overall, little change in the breakdown of own funds by tier when compared to year-end 2021
SFCRs, with a decrease in the total absolute amount of own funds of around 7%. This is driven mainly by a
decrease of 8% in restricted tier 1 own funds and a decrease of 10% in unrestricted tier 1 own funds, due to tier 1
being the dominant form of capital in the reported own funds. The absolute amount of tier 3 own funds has,
however, increased by 29% since our year-end 2021 analysis, indicating that some companies have
reconsidered their capital structures over 2022.
Analysis of solvency coverage
Figure 9 shows the weighted average solvency coverage ratios
15
for the solvency capital requirement (SCR) and
the minimum capital requirement (MCR) across European countries.
FIGURE 9: SOLVENCY COVERAGE RATIOS BY COUNTRY
Overall, the average solvency coverage ratios for European life insurers are more than double the Solvency II
requirement, with the weighted averages significantly in excess of the required solvency coverage ratio of 100%
in all the regions considered. The European average SCR coverage ratio is 244% based on the companies
included in our sample (an increase from the 240% observed at year-end 2021). Some countries in our sample
saw an increase in the weighted average solvency coverage in their market whereas others saw a decrease. The
largest increases were noted in Germany (+70% versus year-end 2021), UK (+26%), ROE (+27) and
Luxembourg (+19%). In Germany, this increase was predominantly driven by some of the largest firms seeing
significant decreases in solvency capital requirements over the year relative to smaller decreases in, or even
increases in, the firms’ eligible own funds over the same period. However, we do also note that part of the
increase could be caused by differences in the sample for Germany as companies were included this year which
were not included last year with relatively high solvency ratios. The addition of these firms has contributed +10%
to the average solvency coverage in Germany. The increase in UK is also driven by SCRs on average
decreasing by more than own funds over the year.
15
The weighted average solvency coverage ratios are calculated as the sum of all eligible own funds for all companies within our sample in a
given region divided by the sum of all the SCRs.
BE
DE
ES
FR
IE
IT
LU
NL
UK
NOR
CEE
ROE
Europe
RATIO OF
ELIGIBLE
OWN
FUNDS
TO SCR
199%
507%
241%
237%
197%
238%
178%
197%
189%
219%
221%
264%
244%
RATIO OF
ELIGIBLE
OWN
FUNDS
TO MCR
405%
1168%
668%
549%
508%
518%
445%
445%
601%
705%
620%
787%
634%
MILLIMAN RESEARCH REPORT
Analysis of life insurers’ solvency and 14 September 2023
financial condition reports year-end 2022
The regions that saw the largest decreases in SCR coverage ratio over the year were NOR (-39%) and Spain
(-14%). In NOR, this decrease was driven by a large overall increase in SCR compared to a relatively stable own
funds. There was a 20% increase to SCR in NOR, whilst there was a 2% increase in own funds. The country
which contributed most to the overall SCR coverage decrease for NOR was Sweden which saw an increase in
SCR over the year and a concurrent decrease in own funds.
The increase in solvency coverage between year-end 2021 and year-end 2022 may not have been predictable
given the changing economic environment over the past year. In general, this resulted from larger decreases in
SCR compared to own funds, leading to a stronger solvency position. This, in part, was driven by interest rates
rising over the year resulting in higher levels of discounting on both the asset and liability sides of the balance
sheet.
The average MCR coverage ratio for year-end 2022 is 634%. This has moved similarly to the SCR coverage ratio
over the year, increasing from 613%.
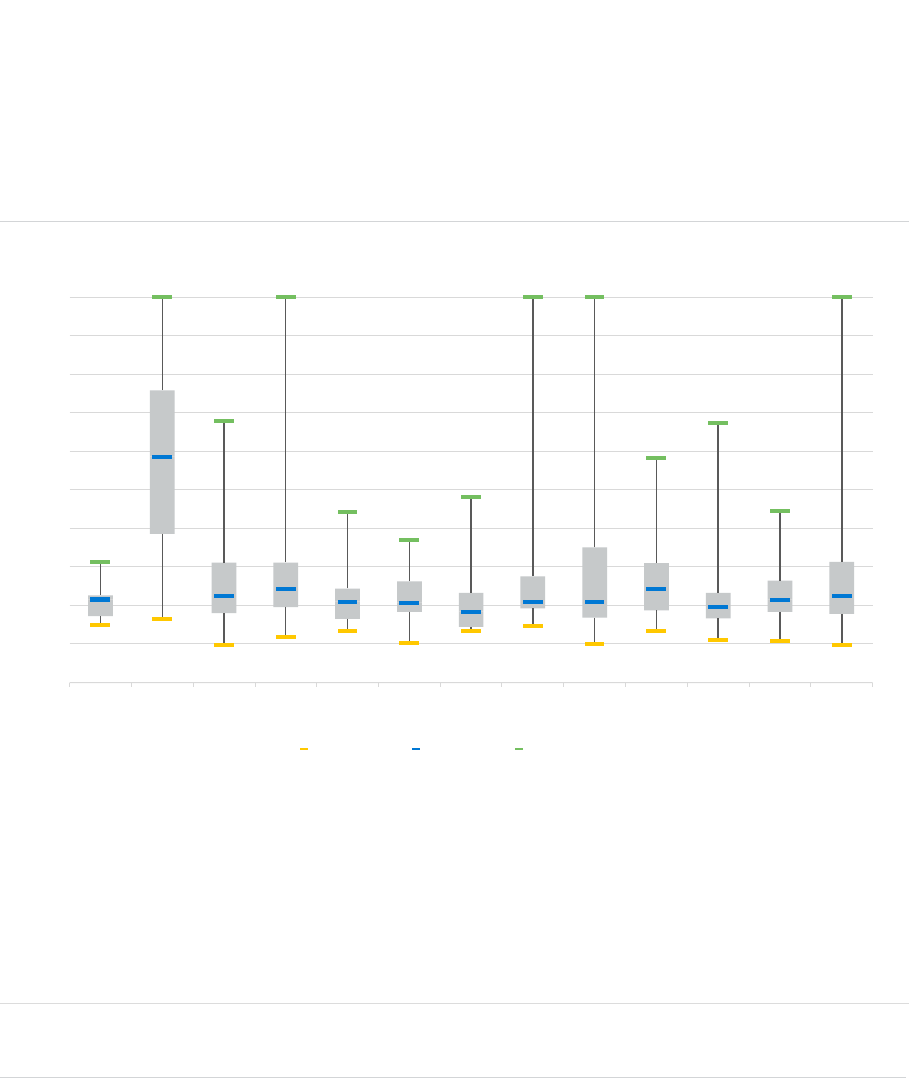
Figure 10 shows the distribution of the SCR coverage ratio by country at year-end 2022. The chart shows the
maximum coverage ratio in green, the minimum in orange and the median in blue. The median is a different
average measure from the weighted average solvency coverage used in Figure 9, and consequently the two
values will not necessarily be the same for each jurisdiction.
FIGURE 10: DISTRIBUTION OF SCR COVERAGE RATIO BY COUNTRY
16
Figure 10 shows that, for most countries, the distribution of SCR coverage ratios has a wide range, although this
does depend on the number of life insurers included in the analysis for each country. The largest ranges are seen
in the UK, France and Germany, where the number of companies included in our analysis is high. The full ranges
cannot be seen on the chart due to the SCR coverage ratios over 1,000% being excluded.
Germany has the highest median solvency coverage ratios in Europe at 587%. The second highest is Finland at
302% (included in NOR), followed by Denmark (also included in NOR) with the third highest at 281%.
16
Note that we have excluded companies where the SCR coverage ratio exceeded 1,000% to allow the chart to be more readable. This excluded
nine companies in the UK, 11 in Germany, one in France and one in the Netherlands.
0%
100%
200%
300%
400%
500%
600%
700%
800%
900%
1000%
BE DE ES FR IE IT LU NL UK NOR CEE ROE Europe
MINIMUM MEDIAN MAXIMUM
244%
The average European SCR coverage ratio
for year-end 2022 is
MILLIMAN RESEARCH REPORT
Analysis of life insurers’ solvency and 15 September 2023
financial condition reports year-end 2022
Based on the life companies included in our analysis, there was one Spanish insurer with an SCR coverage ratio
below 100% at year-end 2022.This situation has been caused mainly by the non-application of the firm’s TMTP
as a result of the sharp rise in market rates.Due to the reported ratio being below 100%, the entity is drawing up a
plan that allows it to recover its solvency level in the short and medium term in accordance with its risk appetite
level.
The second lowest SCR coverage ratio was 100% in respect of one company in the UK, which also reported
100% SCR coverage at year-end 2021. This is due to the company’s own funds being restricted by ring-fenced
fund restrictions such that the company’s own funds equal its SCR. All other firms in our analysis reported an
excess of own funds over their SCR.
Figure 10 shows a maximum SCR coverage ratio of 1,000% in the markets where the highest solvency coverage
is in excess of this. This means that the chart excludes 22 companies which reported SCR coverage ratios in
excess of 1,000% (nine in the UK, eleven in Germany, one in France and one in the Netherlands). The highest of
these companies was from the UK, and it reported an SCR coverage ratio of 4,051%. It should be noted that the
majority of firms with SCR coverage ratio over 1,000% are very small.
The range of the SCR coverage ratios is comparable to that seen in the 2021 year-end SFCRs, and there was a
small overall increase in the median solvency coverage from 221% to 225%.
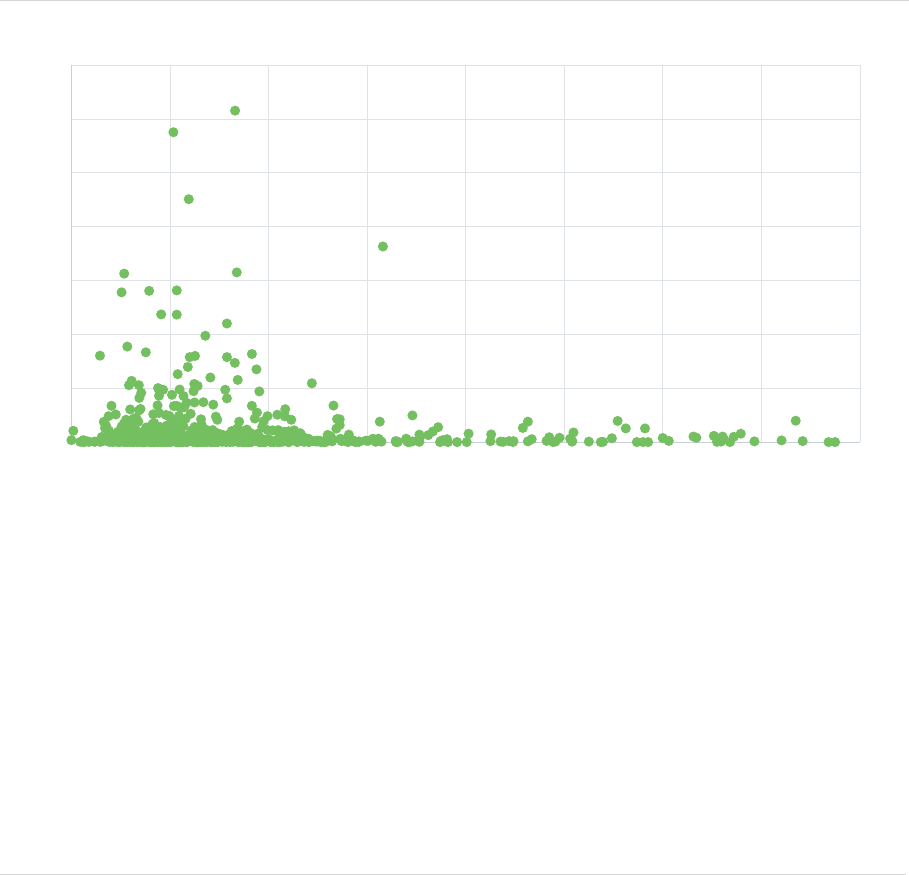
Figure 11 demonstrates the relationship between SCR coverage ratio and SCR size using a scatterplot. Each
point on the scatterplot represents an insurance company. Our whole sample of firms have been included with
the exception of the 22 firms noted above which reported SCR coverage ratios in excess of 1,000%.
FIGURE 11: RELATIONSHIP BETWEEN SCR SIZE AND SCR COVERAGE RATIO
The graph does not precisely display a negative correlation between size of the SCR and SCR coverage ratio;
however it does demonstrate that the firms with the highest SCR coverage ratios typically have smaller SCRs
and therefore are more likely to be smaller firms. Small insurance companies may have small SCRs due to
various factors associated with their size and scale of operations, including benefitting from simpler risk profiles
and lower regulatory requirements resulting from waivers and exemptions. In reality, for very small companies
their reported coverage ratio might be constrained by the absolute minimum capital requirement (AMCR) if this is
larger than their SCR.
Similarly, firms with the largest SCRs tend to have lower SCR coverage ratios, indicating that they likely manage
their capital more closely to an agreed level. Allianz Lebensversicherungs-AG was the only firm to have an SCR
above £1 billion and a coverage ratio above 400%.
0
2
4
6
8
10
12
14
100% 200% 300% 400% 500% 600% 700% 800% 900%
SCR (£ BILLIONS)
SOLVENCY COVERAGE
MILLIMAN RESEARCH REPORT
Analysis of life insurers’ solvency and 16 September 2023
financial condition reports year-end 2022
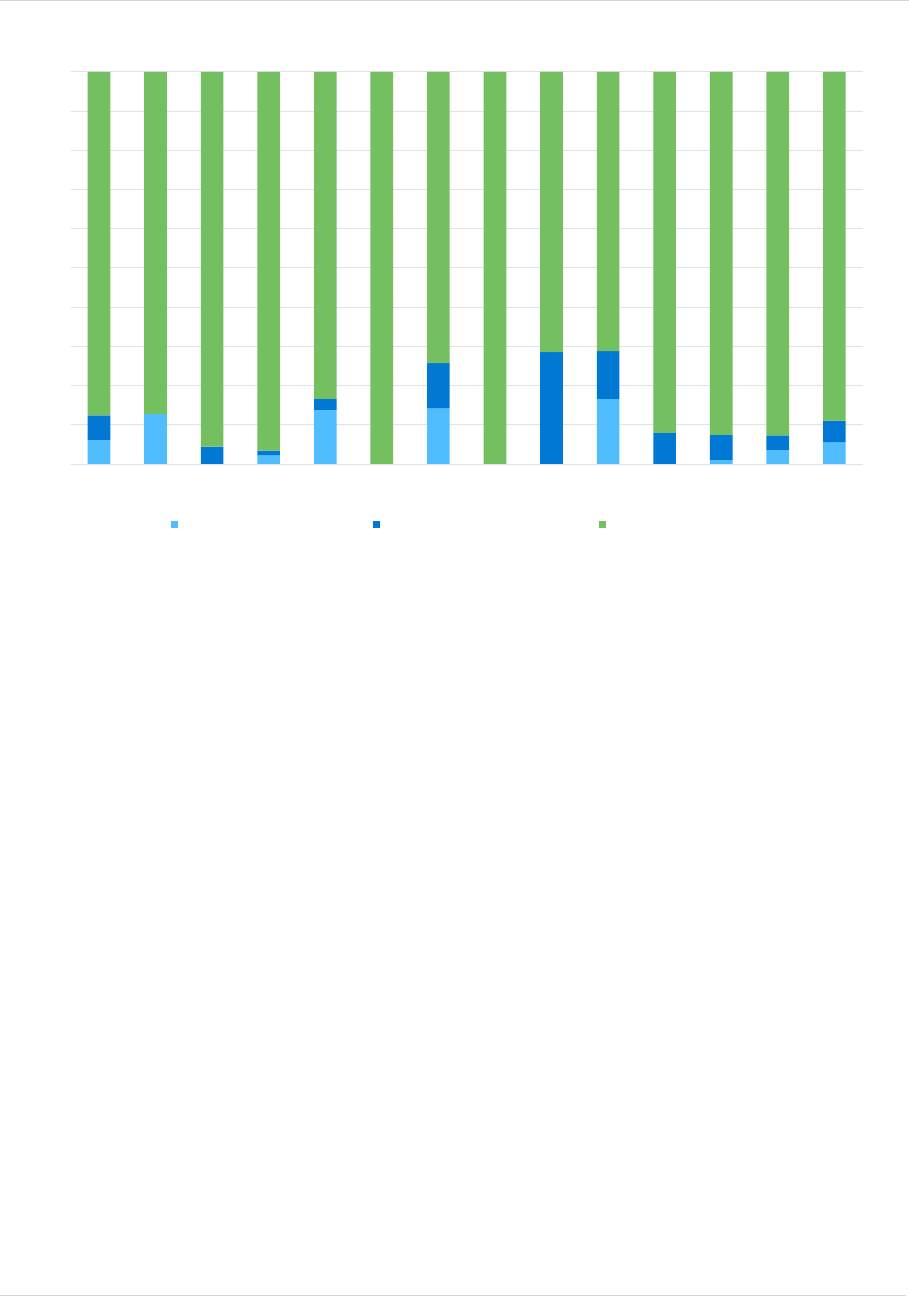
Figure 12 shows the relative uses of the Standard Formula, Partial Internal Model (PIM) and Full Internal Model
(FIM) to calculate the SCR in the various jurisdictions considered in our analysis. Any firms making use of
undertaking-specific parameters (USP) have been included with the Standard Formula companies. Standard
Formula firms are shown in green, PIM firms in dark blue and FIM firms in light blue.
FIGURE 12: SPLIT OF CALCULATION METHOD FOR THE SCR BY COUNTRY
Use of FIMs has proved to be most popular in the UK, Italy, Ireland and Germany, with 17%, 14%, 14% and 13%
of companies included in our sample respectively making use of this calculation method. Across Europe 6% of
firms are using a FIM to calculate the SCR.
The Netherlands, the UK, Denmark and Italy dominate approvals for PIMs. In the Netherlands, 29% of all firms in
our sample make use of a PIM despite no firms reporting the use of a FIM in that market. Across Europe, 5% of
firms are using a PIM to calculate the SCR.
Out of the 675 companies included in our analysis, 600 are companies which report under the Solvency II
Standard Formula (89%). Of the remaining 75 companies (11%), 37 companies were using a PIM, whilst 38
companies were using FIMs.
Most of the largest European markets report the use of some firms with PIM or FIM approval, except for
Luxembourg where all firms report using the Standard Formula. The remaining European market of NOR, CEE
and ROE generally report lower usage of PIMs and FIMs relative to the largest European markets.
Since our previous analysis at year-end 2021, we note one firm moving from using a PIM to using a FIM in
Germany. This is common for firms seeking to use a FIM where they gain approval for a PIM prior to FIM
approval to ease the regulatory burden of the Internal Model Approval Process (IMAP). Two firms moved from
using a FIM to using a PIM: one in Spain and the other in France.
There were no instances of firms moving to the Standard Formula over the year when previously reporting using
either a PIM or a FIM.
Figure 13 shows a split of the SCR coverage ratio distribution by SCR calculation type at year-end 2022. The
chart shows the maximum coverage ratio in green, the minimum in orange and the median in blue.
0%
10%
20%
30%
40%
50%
60%
70%
80%
90%
100%
BE DE ES FR IE IM IT LU NL UK NOR CEE ROE Europe
FULL INTERNAL MODEL
PARTIAL INTERNAL MODEL
STANDARD FORMULA

MILLIMAN RESEARCH REPORT
Analysis of life insurers’ solvency and 17 September 2023
financial condition reports year-end 2022
FIGURE 13: DISTRIBUTION OF SCR COVERAGE RATIOS BY SCR CALCULATION METHOD AT YEAR-END 2021
In our year-end 2021 SFCR analysis, we observed that the PIM and FIM companies had tighter distributions
when compared to Standard Formula. This broadly remains true at year-end 2022 with the key changes over the
year being:
A reduction in the range and interquartile range for FIM firms
An increase in the range for PIM firms but slight decrease in interquartile range
These changes are partly driven by the number of firms included in the FIM category being smaller which has
resulted in a narrower range. The two firms switched methodology from FIM to PIM over the year which helped to
reduce the FIM sample. There were three additional FIM firms added to our analysis for year-end 2022 which
were not included at year-end 2021. However, these firms experienced an average ratio of approximately 225%
resulting in a tighter distribution and smaller inter-quartile range for FIM companies’ SCR coverage ratios for
year-end 2022.
PIM and FIM firms continue to show narrower distributions and slightly lower median SCR coverage ratios than
Standard Formula firms, however, it is difficult to draw any inferences from this other than PIM and FIM firms are
likely to be managing their capital more closely. Figure 13 does suggest that capital may be more closely
managed in companies with a PIM and also, somewhat, by those using a FIM than in those using the Standard
Formula. This may be because internal model companies are more likely to be part of large insurance groups
and therefore may more actively manage their capital. This is consistent with our conclusions drawn from
previous SFCR results.
As in Figure 10, SCR coverage ratios in excess of 1,000% have been excluded from the chart. Of the 22
companies in the 2022 sample with solvency coverage ratios in excess of 1,000%, 21 are classified as Standard
Formula firms and the other uses a FIM. This differs from year-end 2021 where one PIM firm also reported an
SCR coverage ratio in excess of 1,000%.
0%
200%
400%
600%
800%
1000%
ALL FULL INTERNAL MODEL PARTIAL INTERNAL
MODEL
STANDARD FORMULA
MAXIMUM MEDIAN MINIMUM
MILLIMAN RESEARCH REPORT
Analysis of life insurers’ solvency and 18 September 2023
financial condition reports year-end 2022
Analysis of SCR
Figure 14 shows the breakdown of the SCR by risk module for companies across Europe at year-end 2022, with
the European average represented in the last bar on the chart, labelled as ‘Europe.’
FIGURE 14: BREAKDOWN OF SCR BY COUNTRY
17
On average across the EU, market risk makes up the highest proportion of the undiversified SCR (53%) for life
insurers. However, this is a decrease in proportion from the 62% shown in the year-end 2021 SFCR analysis.
Life underwriting risk makes up the second-largest portion (31%). The highest proportion of the undiversified
SCR in Ireland (44%) and in the CEE (33%) is represented by life underwriting risk, whilst for all other regions
market risk is the largest proportion.
The remainder of the undiversified SCR is mostly made up of health underwriting risk (5%), operational risk (4%)
and counterparty default risk (3%). Non-life underwriting risk, other positive adjustments (including capital add
ons) and other risks (including intangible asset risk and underwriting risk which has not been specified as life,
non-life or health) make up the remainder, accounting for around 2%, 2% and less than 1%, respectively.
In countries such as Spain, Belgium and countries in the CEE and ROE categories,
18
some of the companies are
reinsurers or composites, and as such it was difficult to define the distinction between life and non-life companies.
These regions display a greater proportion of their SCRs held in respect of non-life underwriting risk relative to
other regions, as a result.
17
The amounts within this figure are as a percentage of the total of the capital requirement for each risk module, including operational risk (the
undiversified SCR). Each element has been calculated as the sum across the companies within the region.
18
In particular, there is a high proportion of non-life underwriting risk in our sample in Romania, Bulgaria, Slovenia, Czechia, Croatia and Slovakia
in CEE, and Austria and Greece in ROE.
-80%
-60%
-40%
-20%
0%
20%
40%
60%
80%
100%
BE DE ES FR IE IT LU NL UK NOR CEE ROE Europe
MARKET RISK LIFE U/W RISK OP RISK HEALTH U/W RISK
COUNTERPARTY DEFAULT NON-LIFE U/W RISK OTHER RISKS OTHER (+)
DIVERSIFICATION LACTP LACDT OTHER (-)
22%
The
LEVEL OF DIVERSIFICATION
between risk modules of the SCR across Europe (on average)

MILLIMAN RESEARCH REPORT
Analysis of life insurers’ solvency and 19 September 2023
financial condition reports year-end 2022
The diversification of risk results in a reduction of 22% of the undiversified SCR on average across Europe, a 2%
increase from the level of diversification seen at year-end 2021 (20%). This is diversification between the risk
modules and not within the risk modules (which most companies do not disclose in their SFCRs). The amount of
benefit varies widely by country, with diversification benefits highest where there is a wider spread of risk
exposure. For example, Ireland has the highest diversification benefit, reflecting the fact that Irish insurers have a
wide range of risk exposures across market risk, life underwriting risk, health underwriting risk and non-life
underwriting risk, resulting in a reduction of 36%. Other markets with high levels of diversification include Belgium
(28%), the UK (27%), the Netherlands (26%) and CEE (26%).
In addition to diversification benefits, there are two additional adjustments available to companies after diversification:
1. Loss-absorbing capacity of technical provisions (LACTP), which reflects the ability to reduce future
discretionary benefits under stress scenarios. This is particularly common for business which is classed as
‘Insurance with Profit Participation.’
2. Loss-absorbing capacity of deferred tax (LACDT), which reflects the reduction in the future corporation tax
payable under stress scenarios.
The LACTP
19
and the LACDT result in further reductions of 33% and 6%, respectively. This demonstrates a
slightly bigger adjustment in LACTP compared to the results at year-end 2021 where LACTP resulted in a 29%
reduction to the undiversified SCR. This seems to largely be driven by Italy and Luxembourg which have seen
notable increases in the benefit arising from LACTP. The LACDT adjustment remains broadly unchanged from
the year-end 2021 figure of 7%.
LACTP is largest in Denmark and Norway
20
with a 58% reduction in both markets. This is reflective of Danish and
Norwegian life insurance TPs being around 40% and 65% ‘Insurance with Profit Participation’ business, respectively,
as well as a few large firms in these countries holding almost exclusively this type of business and receiving a
significant benefit from LACTP. LACDT is largest in Spain with a 16% reduction in SCR similar to last year-end.
The regions with the highest exposure to market risk are France (58%), Netherlands (54%), Luxembourg (51%),
Germany (49%) and the NOR (67%). Two of these regions, France and Germany are also amongst the regions
with the largest proportions of TPs in respect of ‘Insurance with Profit Participation,’ making up 69% and 81% of
TPs, respectively. This is somewhat unsurprising, as the investment guarantees associated with these contracts
can result in a high exposure to market risk.
These countries also benefit from significant reductions as a proportion of the undiversified SCR reflecting the
LACTP associated with ‘Insurance with Profit Participation’ business, including a 50% reduction for Germany and
45% for France.
Unfortunately, due to the nature of the public disclosure requirements for PIMs and FIMs, it is not straightforward
to make a direct comparison with Standard Formula firms to analyse the SCR breakdown by risk type, as the risk
exposures captured in the internal models vary by company. Where reasonable we have mapped the risks
resulting from the PIMs and FIMs into the Standard Formula structure for comparison in Figure 14.
The breakdown of the SCR has not changed significantly since the previous set of SFCRs were published.
19
Some companies reported their other risk modules after the risk-mitigation generated by their LACTP. Where this has happened, we have
assumed that the LACTP is offsetting the market risk module and adjusted it to be pre-LACTP. This method of reporting is common in certain
markets such as France.
20
Included within the NOR. The third highest LACTP is found in Germany.
MILLIMAN RESEARCH REPORT
Analysis of life insurers’ solvency and 20 September 2023
financial condition reports year-end 2022
Long-term guarantee measures
A number of European life insurers in our sample use long-term guarantee measures (LTGMs). The measures
which are available to insurers and are discussed in this report are:
Matching adjustment (MA)
Volatility adjustment (VA)
Transitional measure on technical provisions (TMTP)
We have not included any analysis on the transitional measure on interest rates due to the very small uptake of
this LTGM across Europe.
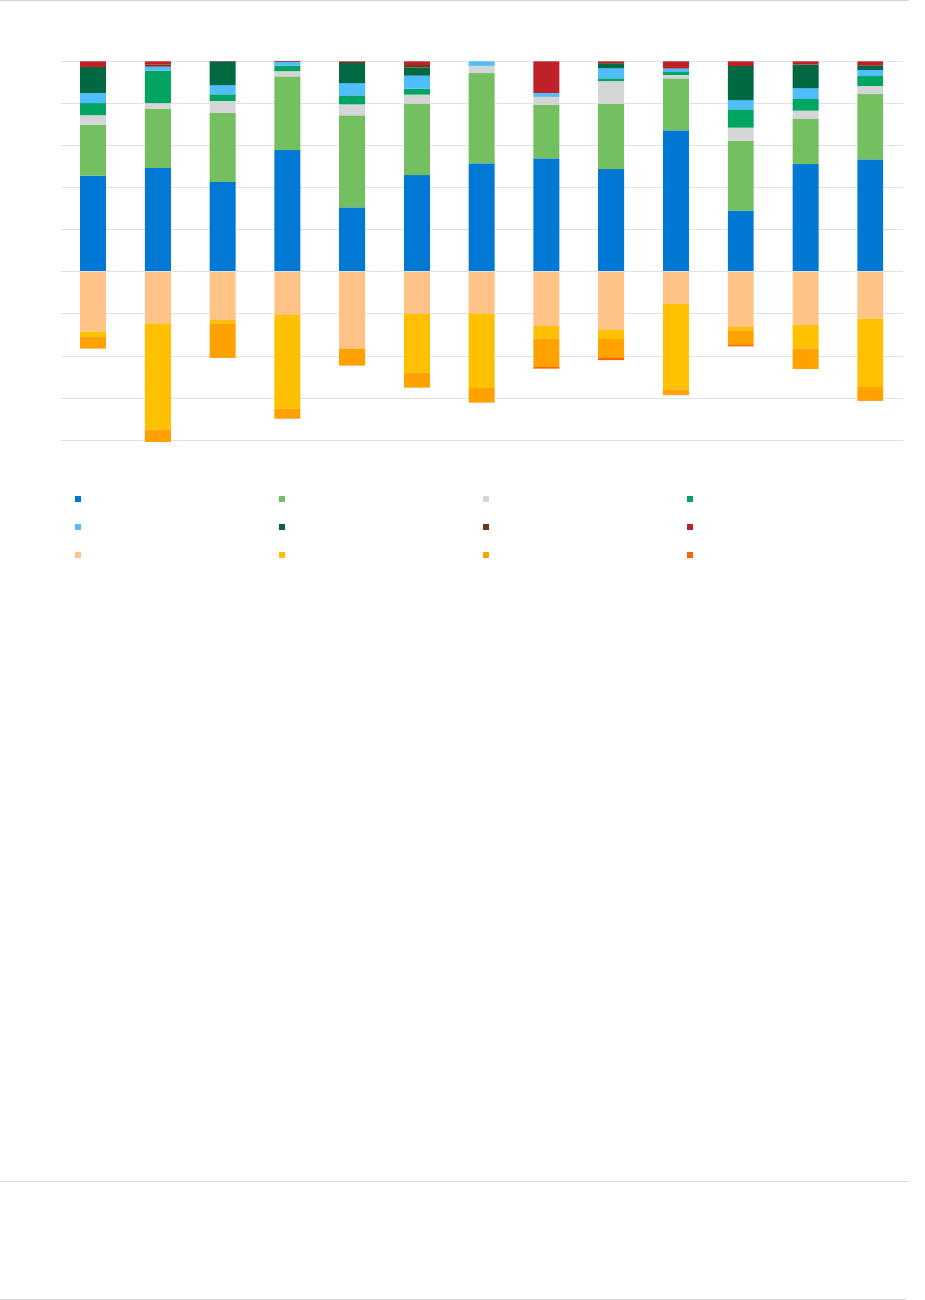
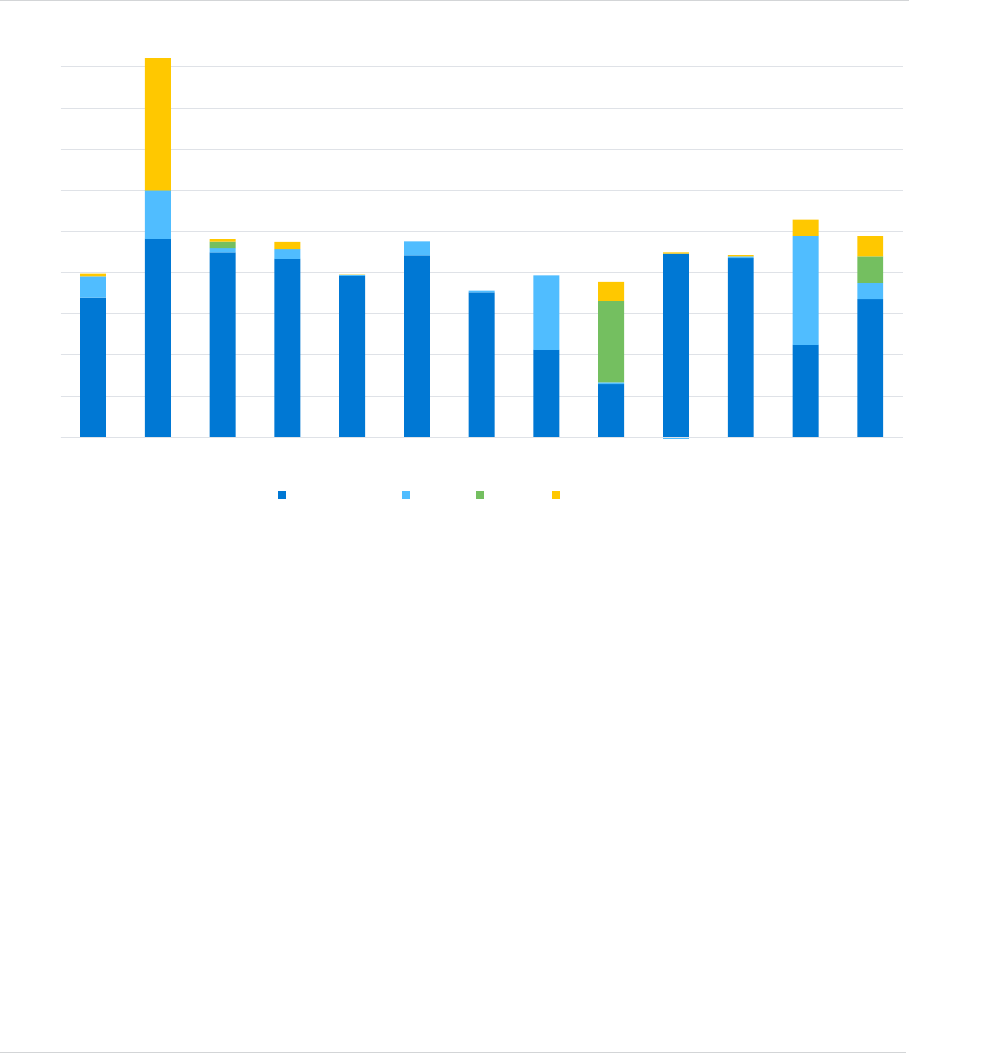
Figure 15 shows the breakdown of the SCR coverage ratio by the different LTGM and non-LTGM components (at
year-end 2022) for each of the regions analysed in this report. The total across all companies in our sample is
also shown.
FIGURE 15: BREAKDOWN OF SCR COVERAGE RATIO BY LONG-TERM GUARANTEE MEASURE
Figure 15 shows that different countries place
different levels of reliance on the various LTGMs.
The VA is the most widely used measure, used by
52% of all companies in our sample, including
having some impact on all of the largest markets
shown on the chart. It has the largest impact in the
Netherlands, where it increased the SCR coverage ratio by 91 percentage points on average. Since last year’s
analysis, we have seen no change in the benefit arising from the VA on European life insurer’s solvency
coverage ratios remaining at 14 percentage points.
In general, usage of the VA is lower in countries where prior approval by the regulator is required, such as the UK
and Ireland (increasing the SCR by approximately one percentage point in each country).
0%
50%
100%
150%
200%
250%
300%
350%
400%
450%
BE DE ES FR IE IT LU NL UK NOR CEE ROE Europe
NO LTGM VA MA TMTP
of all companies
in our report apply the VA
52%

MILLIMAN RESEARCH REPORT
Analysis of life insurers’ solvency and 21 September 2023
financial condition reports year-end 2022
Approval to use the VA is also required in Denmark; however, there is slightly higher VA usage there
(contributing 7 percentage points of the SCR coverage ratio). There are also substantial VA impacts in Germany
(59 percentage points), Belgium (26 percentage points), Austria (25 percentage points) and Italy (17 percentage
points). Higher take-up in countries such as Germany and the Netherlands could be due to the possibility of using
the dynamic volatility adjustment (DVA). The DVA is an adjustment to the Solvency II yield curve as with the non-
dynamic VA, but with allowance for variation under stress, i.e., the size of the VA applied will vary across the
different SCR stresses. The DVA is not currently permitted in all jurisdictions in our analysis, nor is it reported
separately to the non-dynamic VA, and consequently we are unable to separate the DVA out in our analysis.
The TMTP is currently being used by 15 of the countries in our sample. The SCR coverage ratio in Germany is
208 percentage points higher on average due to the use of the TMTP, the highest impact of any country from any
LTGM measure in our sample. 69% of the German companies in our report apply the TMTP, with some showing
very large benefits from its use. The large impact of the TMTP in Germany can be primarily attributed to the
Solvency I regime in Germany using a book value accounting method and the rates of interest used in the
valuation of the liabilities being relatively high when compared to the current Solvency II discount curve.
The other countries which receive significant benefits from using the TMTP are Portugal (25 percentage points),
Austria (25 percentage points), the UK (23 percentage points) and Finland (19 percentage points). Across
Europe the TMTP contributes 25 percentage points to European life insurers’ SCR coverage ratios.
The MA is the least frequently used LTGM, with impacts arising only from insurers in the UK and Spain. It
contributes 101 percentage points to the UK and 8 percentage points to Spain for each country’s SCR coverage
ratio based on the companies in our sample. Despite the low number of markets utilising the MA, across Europe
the MA contributes 33 percentage points to European life insurers’ SCR coverage ratios. This is driven by the
significant benefit arising in the UK which is the largest market by TPs in our analysis.
There are a number of countries where no companies in our sample report the use of LTGMs: Croatia, Cyprus,
Iceland, Latvia, Lithuania, Malta, Poland and Romania, as well as Gibraltar, Guernsey and the Isle of Man.
Meanwhile in Bulgaria, Czechia, Hungary, Ireland, Liechtenstein, Luxembourg, Norway and Sweden, take-up has
been low, with only a small number of companies using either the VA or the TMTP (contributing less than five
percentage points to the total solvency coverage ratio).
When comparing the results in this report to the previous SFCR report, in aggregate there has been a decrease
of six percentage points in the benefit received for using LTGMs across European life insurers. These decreases
are likely due to the following:
The TMTP benefits reduce by one-sixteenth each year as they run off, although on some occasions,
recalculations of the measure, where required, have led to increases in the TMTP benefit in a number of
jurisdictions. Since our previous analysis, the TMTP benefit has increased in Germany (+31%), Belgium
(+1%), Ireland (+0.3%) and CEE (+0.1%). However, these increases were not material enough to cause an
overall increase in the level of TMTP benefit across all of Europe relative to the year-end 2021 SFCRs, with
the overall benefit reducing by four percentage points over the year.
MA benefit has decreased over the year across all of Europe, down by two percentage points when
compared with year-end 2021. This is despite an increase to the MA benefits in the UK (increasing from an
80 percentage point benefit in 2021 to 101 percentage points in 2022) and Spain (increasing from a 5
percentage point benefit in 2021 to 8 percentage points in 2022). This overall decrease to the MA benefit can
be attributed to a slight dilution of the UK’s market share since 2021 year-end, with the UK’s TPs as a
percentage of the whole of Europe’s TPs falling from 29% to 28%. In particular, the total UK SCR as a
percentage of the total European SCR fell by three percentage points from 21% to 18%, whilst the total UK-
eligible own funds as a percentage of the total European-eligible own funds fell only by one percentage point
from 15% to 14%.
MILLIMAN RESEARCH REPORT
Analysis of life insurers’ solvency and 22 September 2023
financial condition reports year-end 2022
VA benefit has remained relatively stable when compared to year-end 2021, increasing by 0.3 percentage
points, with different impacts seen across the various European markets. For example:
− Increases in the VA rates for some currencies including Bulgarian lev (+39bps), British pound sterling
(+21bps), euro (+16bps), Hungarian forint (+12bps), Czech koruna (+3bps) and Icelandic króna (+1bp).
− Decreases in the VA rates for some currencies including Danish krone (-32bps), Norwegian krone
(-27bps), Swedish krona (-14bps), Swiss franc
21
(-7bps) and Croatian kuna (-1bp).
The decreases in the VA in the Nordic countries resulted in an 8% reduction in the VA benefit for the region
as a whole, whilst the increases in the VA in the euro and the British pound resulted in a 1% increase in the
VA benefit in CEE and a 2% increase across the nine largest markets. Given the significance of these
largest markets, the decrease in the VA benefit in the Nordic countries was broadly offset by the increase in
the VA benefit from the largest markets.
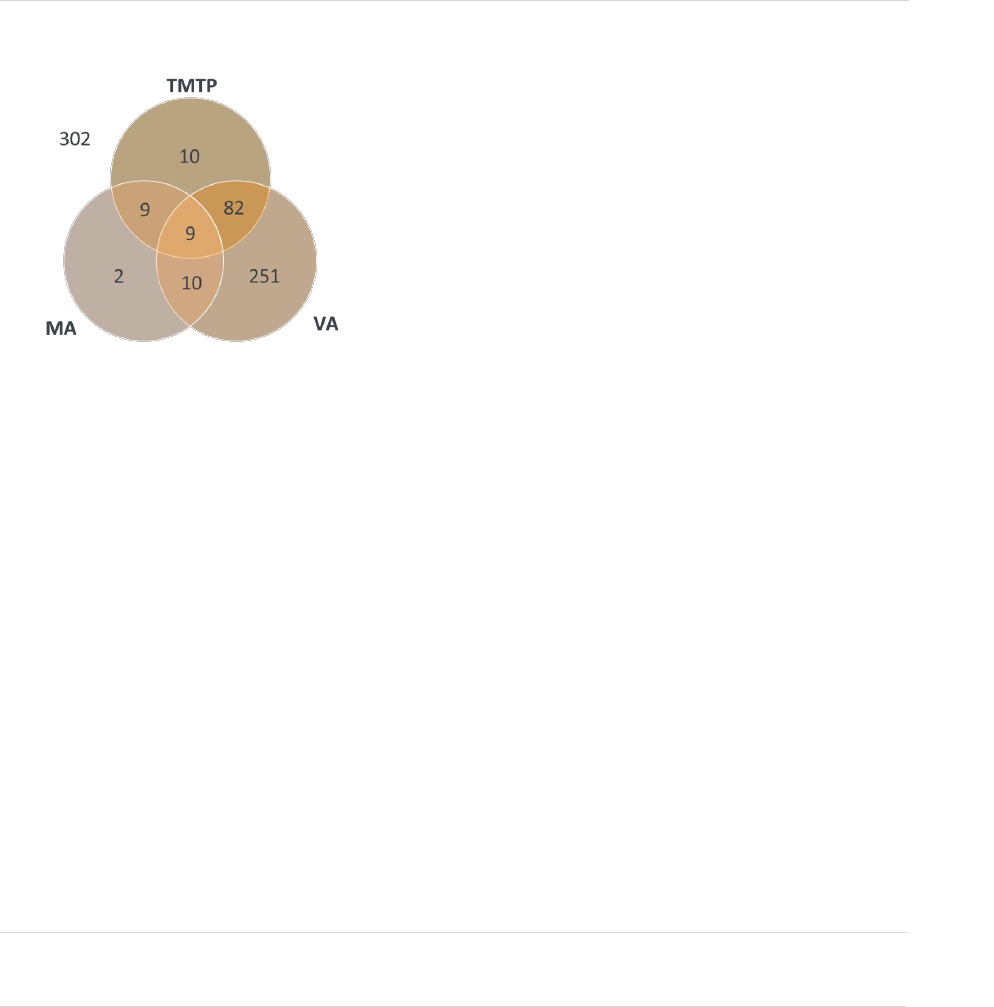
Of the companies in our sample, 352 are using the VA, 30 are using the MA (of which 19 are in the UK) and 110
are using the TMTP (of which 54 are in Germany) at year-end 2022. Some companies use different combinations
of the LTGMs as shown in the Venn diagramme in Figure 16. Of the European life companies in our sample, 302
did not use any of the LTGM at year-end 2022.
FIGURE 16: NUMBER OF COMPANIES USING LONG-TERM GUARANTEE MEASURES
The number of firms in our sample using the VA and the MA has increased over the year, whilst the number of
firms using the TMTP has decreased. At year-end 2021, 342 firms were using the VA, 29 firms were using the
MA and 140 firms were using the TMTP. There was also a reduction in the number of firms not using any LTGMs
(322 firms at year-end 2021). The reductions are reflective of the smaller overall sample size which is driven by
availability of data in Solvency II Wire at the time of analysis and also reflects the general trend of consolidation
across Europe.
21
Although Switzerland is not included in our analysis as it does not report under Solvency II, the Swiss franc has been included as it is the
reporting currency used by a number of firms in Liechtenstein.
Of our sample of
European Life Firms:
used the
VOLATILITY ADJUSTMENT
used the
MATCHING ADJUSTMENT
used the
TMTP
352
30
110

MILLIMAN RESEARCH REPORT
Analysis of life insurers’ solvency and 23 September 2023
financial condition reports year-end 2022
Conclusion
There has been an overall increase in the
level of firms’ SCR coverage ratio relative to
last year and a 14% decrease in gross TPs.
However, in general, there has not been a
significant amount of change in the
individual items of European life insurers’
balance sheets.
European life insurers continue to favour
government and corporate bonds as
investment categories, investing
approximately 56% of their total assets
(excluding Index-Linked and Unit-Linked
assets) in these categories, on average.
The mix of life insurance business varies across Europe, with many markets (including Belgium, France,
Germany and Italy) continuing to be dominated by ‘Insurance with Profit Participation’ business, whilst the market
in other countries (such as Ireland, Luxembourg and the UK) continue to be predominantly in respect of ‘IL and
UL Insurance’ business.
However, despite the different business mix, overall European life insurers had high levels of solvency cover
relative to the minimum required capital based on the disclosures in the year-end 2022 SFCRs, with an average
SCR coverage ratio of 244%. Despite the economic uncertainty throughout European over the past year, this
represents a slight improvement on the year-end 2021 SFCRs, which had an average SCR coverage ratio of
240%. This has been driven by larger decreases in SCR compared to own funds, partly resulting from higher
interest rates.
GWPs have fallen compared to last year, potentially due to the uncertain economic and geopolitical landscape,
meaning households have less disposable income. Total GWP across Europe totalled £686 billion in 2022,
representing a 5% decrease from £725 billion in 2021.
Own funds are predominantly comprised of tier 1 unrestricted own funds (91%), which is the highest form of
capital in terms of quality and loss absorbency as defined under Solvency II. There has been overall no change in
the breakdown of own funds into the different tiers, however the absolute amounts of all the tiers have decreased
whilst tier 3 own funds have increased by 29% indicating that some firms have reconsidered their capital
structure over the year.
For most countries, the largest constituent parts of their undiversified SCRs are market risk, with life underwriting
risk being the second largest component. LACTP and diversification represent the largest reductions to the SCR.
The LTGMs are used to different extents in each country, with the VA the most widely used. However, in
countries where the TMTP or the MA, or indeed both, are used, they often have much higher impacts on the SCR
coverage ratio than the VA. The benefit from the LTGMs to the solvency coverage has decreased since year-end
2021 primarily as a result of the run-off of TMTP benefits and the reduction in MA benefit over the year. The
TMTP benefits will continue to run-off as we move further through the 16-year transitional period.
The average European SCR coverage ratio
has IMPROVED
over the year
from
240%
to
244%
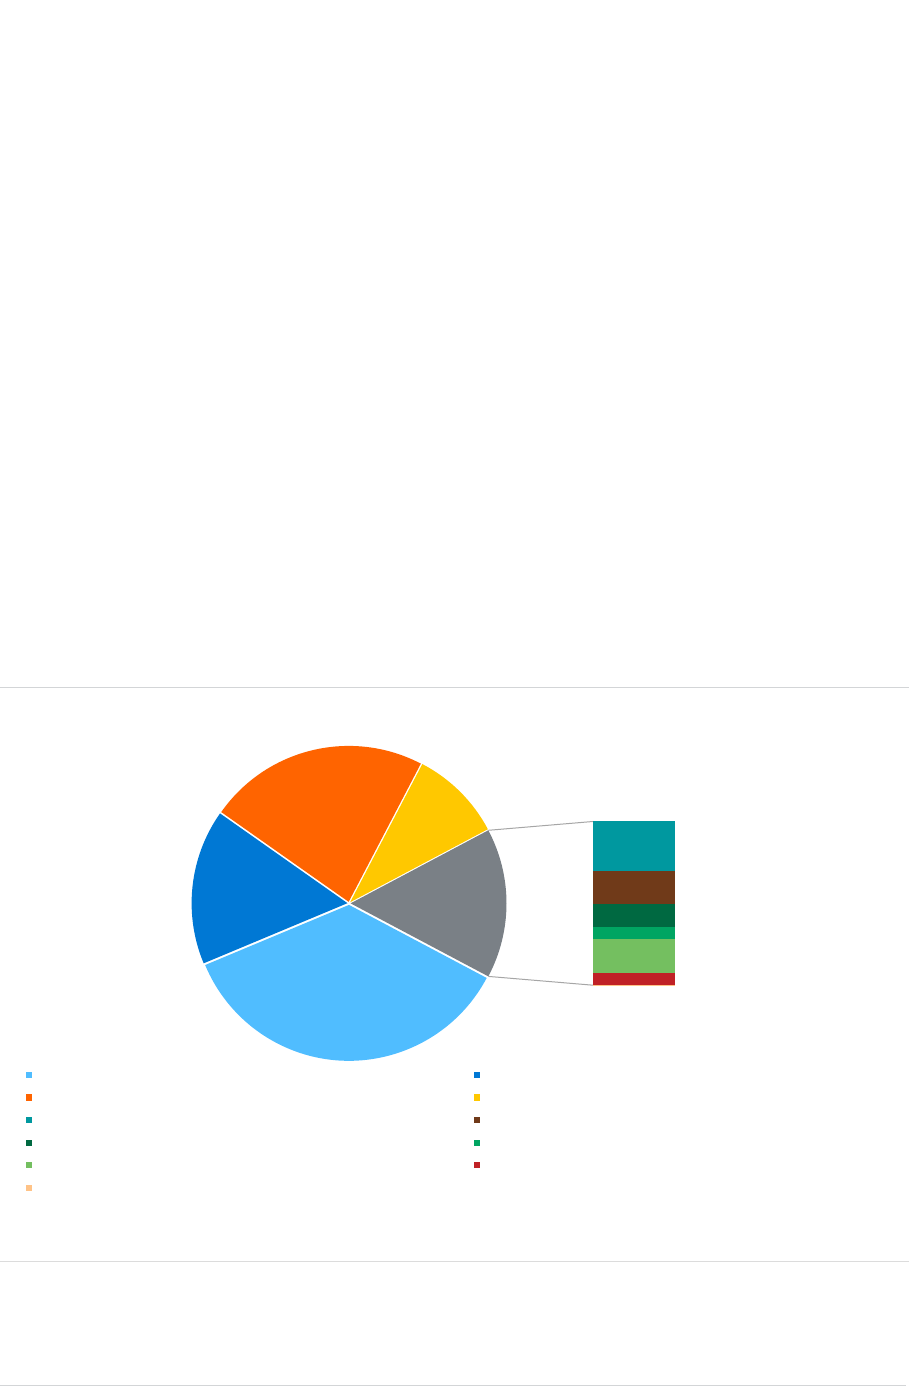
MILLIMAN RESEARCH REPORT
Analysis of life insurers’ solvency and 24 September 2023
financial condition reports year-end 2022
Section 2: Analysis of UK life insurers
UK MARKET COVERAGE
Our analysis for 2022 is based on 66 life insurance companies
authorised in the UK (68 for 2021).
22
This sample includes
domestic companies selling within the UK market only and a
small number with cross-border sales. The companies chosen
for this report are all mainly life insurers and reinsurers,
including mutual societies, annuity writers, bulk-purchase
annuity providers and closed-book consolidators.
The 66 companies in the UK section of our report represent
approximately £216 billion (€244 billion) of GWP and
approximately £1.850 trillion (€2.086 trillion) of gross life TPs,
which is estimated to represent the majority of gross TPs in the
UK. This represents a small reduction in the number of solo
firms (68), GWP (£227 billion) and gross life TPs (£2.223
trillion) versus year-end 2021.
Appendix 1 contains a list of all the UK life insurance companies included in our analysis at year-end 2022. This
list looks at solo SFCRs only, and some companies within the list operate within the same insurance groups as
other companies within the list.
Analysis of balance sheet
ASSETS
The asset side of the balance sheet for the average UK life company at year-end 2022 is primarily comprised of
financial investments. The breakdown of non-linked financial investments for the UK life insurance market based
on our sample of companies is shown in Figure 17.
FIGURE 17: SPLIT OF NON-LINKED
23
FINANCIAL INVESTMENTS BY ASSET CLASS
24
22
The number of companies in our sample has decreased over the year. This is due to consolidation of some companies within the market as
well as some smaller companies not being included based on availability of their SFCRs at the time of writing either this year or last year.
23
Does not include ‘Assets held for Index-Linked and Unit-Linked Contracts.’
24
Chart breakdown adds up to 99% due to rounding.
38%
17%
24%
10%
5%
3%
2%
1%
-3%
1%
10%
CORPORATE BONDS GOVERNMENT BONDS
HOLDINGS IN RELATED UNDERTAKINGS, INCLUDING PARTICIPATIONS COLLECTIVE INVESTMENTS UNDERTAKINGS
EQUITY OTHER BONDS
PROPERTY CASH AND CASH EQUIVALENTS
NET DERIVATIVES DEPOSITS OTHER THAN CASH EQUIVALENTS
OTHER INVESTMENTS
Our analysis of the
UK life insurance
market covers:
66 LIFE INSURERS
£216 BILLION
of gross written premiums
£1.850 TRILLION
of gross technical provisions

MILLIMAN RESEARCH REPORT
Analysis of life insurers’ solvency and 25 September 2023
financial condition reports year-end 2022
Outside of the ‘Assets Held for IL and UL Contracts,’ UK life insurers are heavily invested in bonds, with a focus
on investment in corporate bonds (38%) over government bonds (17%). Other sizeable investment categories
are holdings in related undertakings (24%) and collective investment undertakings (10%). The final 10% of
investments is spread across a number of smaller asset categories, including equity (5%), other bonds (3%),
property (2%), cash and cash equivalents (1%), net derivatives (-3%), deposits other than cash equivalents (1%),
and other investments (<1%).
Holdings in related undertakings come almost entirely from four of the largest insurance groups: M&G,
25
Phoenix,
26
Aviva
27
and Royal London, which combined make up 96% of this category. Other insurers exhibit a
greater concentration in government and corporate bonds as well as collective investments undertakings in the
absence of such exposures to related undertakings.
There has been growth in the overall level of holdings in related undertakings (24% this year compared to 20%
last year) and a reduction in the proportion of assets held in government bonds (17% this year compared to 20%
last year). There has also been a switch in the net derivative position (-3% this year compared to 1% last year),
with only small changes in the proportion of other asset classes. There has, however, been a notable decline
over the year in the absolute level of corporate bonds (£264 billion last year compared to £217 billion this year),
despite the overall proportion of assets held in corporate bonds increasing from 37% to 38%, and equities (£42
billion last year compared to £28 billion this year). This trend was also observed in 2021, with the decline this
year being even more substantial. Together with the decrease in assets held in government bonds and net
derivatives, these categories account for the majority of the decline (90%) in total asset holdings by UK life
insurers over the year (falling from £713 billion last year compared to £564 billion this year).
LIABILITIES
Figure 18 shows the breakdown of the total UK life insurers’ TPs between the Solvency II lines of business, gross
of reinsurance, at year-end 2022.
FIGURE 18: SPLIT OF TOTAL UK LIFE INSURERS TECHNICAL PROVISIONS BY PRODUCT GROUPS
Figure 18 shows that the majority of UK life insurers’ TPs are made up of ‘IL and UL Insurance’ (62%). ‘Other Life
Insurance,’ ‘Insurance with Profit Participation’ and ‘Accepted Reinsurance’ are the other significant product
classes, at 16%, 11% and 11%, respectively. ‘Annuities (Stemming from Non-Life Insurance Contracts)’ accounts
for around 0.01% of the total TPs and is not shown on the chart due to its small size.
25
M&G Group includes Prudential Pensions and the Prudential Assurance Society.
26
Phoenix Group includes the acquisitions of Standard Life, ReAssure, Quilter Life & Pensions, and Sun Life Assurance Company of Canada, as
well as Phoenix Life Assurance Limited and Phoenix Life Limited.
27
Aviva Group contains Aviva Life & Pensions, Aviva Investors Pensions and Aviva International Insurance.
11%
62%
16%
11%
INSURANCE WITH PROFIT
PARTICIPATION
IL AND UL INSURANCE
OTHER LIFE INSURANCE
ACCEPTED REINSURANCE
The UK life insurance
market is dominated by
INDEX-LINKED
AND UNIT-LINKED
INSURANCE,
accounting for
62%
OF TECHNICAL
PROVISIONS
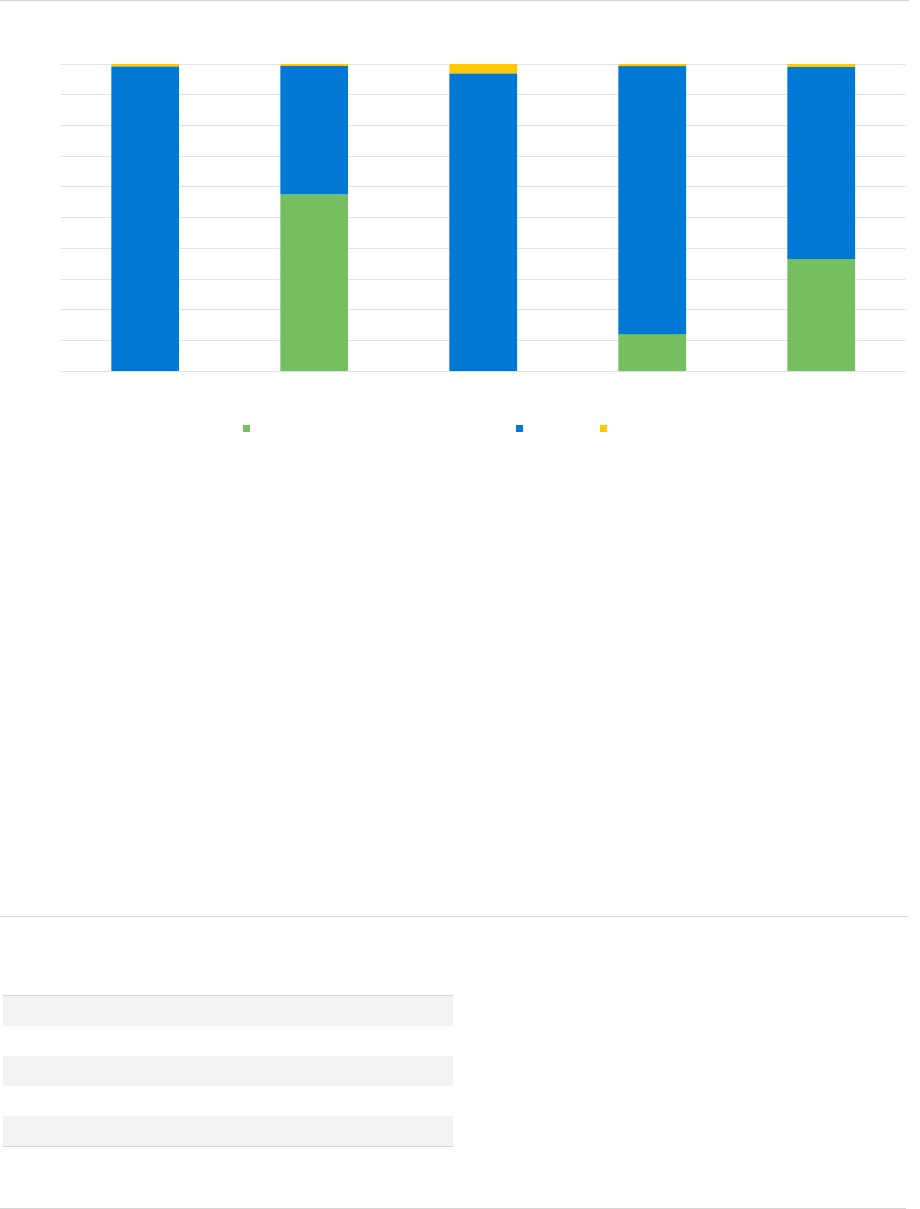
MILLIMAN RESEARCH REPORT
Analysis of life insurers’ solvency and 26 September 2023
financial condition reports year-end 2022
Overall, the total value of life TPs in our sample has fallen from £2.223 trillion at year-end 2021 to £1.850 trillion
at year-end 2022 with the majority of this decline coming from a decrease in ‘IL and UL Insurance’ TPs (falling
from £1.346 trillion to £1.137 trillion over the year). There have been small absolute decreases in all of the other
categories over the year, however the proportions of the market held in each of the product groups has remained
relatively unchanged.
The TPs can be broken down further. A breakdown of the TPs for BEL, RM and 'TPs Calculated as a Whole’ is
shown in Figure 19, split by the Solvency II lines of business.
FIGURE 19: SPLIT OF TECHNICAL PROVISIONS FOR EACH PRODUCT GROUP
‘TPs Calculated as a Whole’ are only significant for ‘IL and UL Insurance’ business and ‘Accepted Reinsurance,’
accounting for 58% and 12% of TPs, respectively. These represent similar proportions as those at year-end
2021. The ‘TPs Calculated as a Whole’ under the ‘Accepted Reinsurance’ category is a result of 10 providers all
with significant volumes of reinsured ‘IL and UL Insurance’ business, with the majority of firms using this category
to denote the unit-linked liabilities.
‘TPs Calculated as a Whole’ contributes a relatively large proportion (37%) of the overall TPs due to the
significance of ‘IL and UL Insurance’ business within the UK’s TPs. The proportion of ‘TPs Calculated as a
Whole' has increased marginally relative to year-end 2021. ‘TPs Calculated as a Whole’ is predominantly used by
firms to report the size of the unit-linked funds with firms reporting the non-unit part of the reserve under BEL. It
should be noted that not all firms with ‘IL and UL Insurance’ business report the unit-linked liabilities within ‘TPs
Calculated as a Whole’ and instead some companies report it within the BEL figure.
The BEL makes up more than 40% of the TPs for every product group, including 63% of the total insurance
market, whilst the RM ranges from only 0.5% of ‘IL and UL Insurance’ TPs to 3.0% of ‘Other Life Insurance’ TPs.
Although it has been excluded from Figure 19 due to its size, ‘Annuities (Stemming from Non-Life Insurance
Contracts)’ shows a RM of 5.1% as shown in Figure 20.
Figure 20 shows the RM as a proportion of TPs for each Solvency II line of business at year-end 2022.
FIGURE 20: RATIO OF RISK MARGIN TO TECHNICAL PROVISIONS BY PRODUCT GROUP
RM/TP %
INSURANCE WITH PROFIT PARTICIPATION
0.8%
IL AND UL INSURANCE
0.5%
OTHER LIFE INSURANCE
3.0%
ANNUITIES (STEMMING FROM NON-LIFE)
5.1%
ACCEPTED REINSURANCE
0.6%
TOTAL
1.0%
0%
10%
20%
30%
40%
50%
60%
70%
80%
90%
100%
INSURANCE WITH PROFIT
PARTICIPATION
IL AND UL INSURANCE OTHER LIFE INSURANCE ACCEPTED REINSURANCE TOTAL
TPS CALCULATED AS A WHOLE BEL RM
The average ratio of risk margin
to Technical Provisions is
1.0%
1
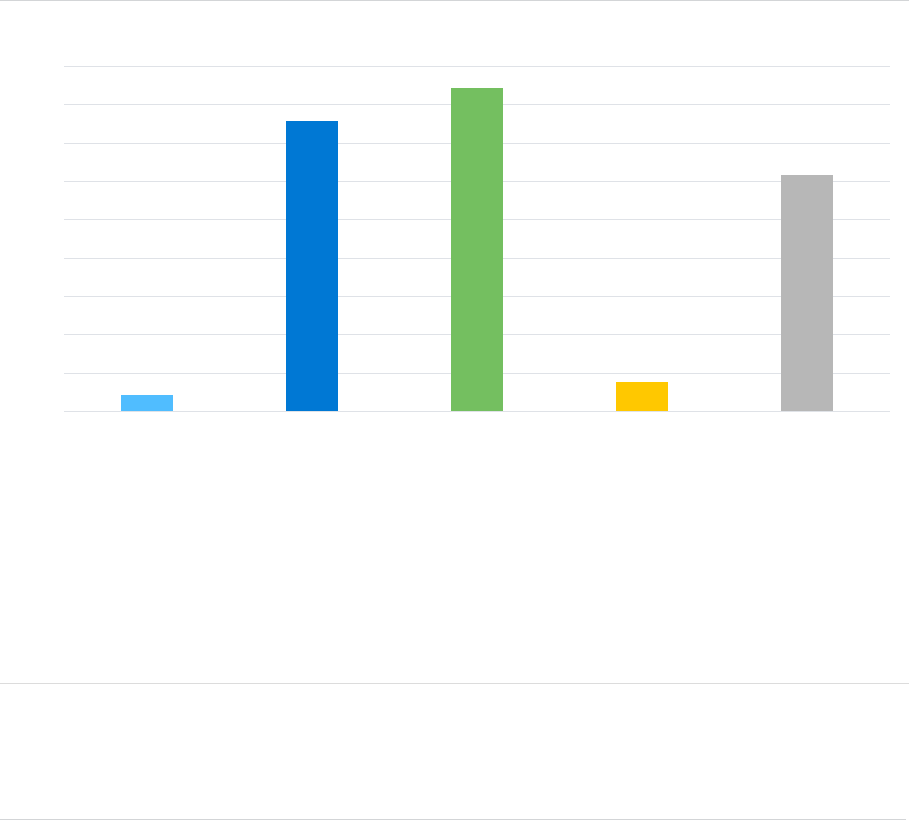
MILLIMAN RESEARCH REPORT
Analysis of life insurers’ solvency and 27 September 2023
financial condition reports year-end 2022
The RM for ‘IL and UL Insurance’ is the smallest proportion of TPs, which could be due to the majority of risks being
passed onto policyholders as well as some firms making use of a short contract boundary, thus leading to a lower
RM.
28
‘Annuities (Stemming from Non-Life Insurance Contracts)’ has the most significant RM at 5.1% of TPs, followed
by ‘Other Life Insurance’ at 3.0%. These categories incorporate all other product types, including annuities and
protection business, for which the RM is relatively high compared to the other product categories. This is due, in part, to
the particularly long duration of annuity liabilities and the relatively small BEL for protection business.
Across our sample of UK companies and across all lines of business, the RM is about 1.0% of TPs. This is a
decrease on the results at year-end 2021 which showed a RM of 1.4%. This is likely driven by higher interest
rates which lead to a greater level of discounting in the calculation of the RM. More generally, the breakdown of
the BEL by product type has shown little change since the year-end 2021 SFCRs.
The RM is one of the key areas under review as part of the UK Review of Solvency II, with the Prudential
Regulation Authority’s (PRA’s) Consultation Paper 12/23 (CP12/23) covering the first set of proposed reforms to
Solvency II in the UK. The changes set out by the PRA to the calculation of the RM comprise the introduction of a
lambda factor
29
of 0.9 with a floor of 0.25 alongside a reduction to the cost of capital to 4%. These changes are
expected to be introduced by the PRA for 31 December 2023, and we estimate that the RM of UK life insurers
will reduce by around two-thirds across the industry as a result.
REINSURANCE
Reinsurance is widely used by UK life insurers, with reinsurance recoverables of £228 billion (€257 billion), i.e.,
12.3% of life TPs across the 66 life insurers in the sample.
Figure 21 shows the reinsurance recoverables as a percentage of the TPs for each of the main Solvency II lines
of business at year-end 2022, alongside the total ceded percentage for UK life insurers as a whole.
FIGURE 21: PERCENTAGE OF TECHNICAL PROVISIONS WITH REINSURANCE
28
It is noted that for companies writing multiple lines of business, there may be an element of subjectivity in how they allocate the risk margin
across the different lines of business.
29
The lambda factor is a method of tapering the risks projected under the risk margin calculation. This method has been assessed by EIOPA and
the PRA with options for the potential parameters which will define this approach under discussion. See the Milliman paper on the PRA’s
CP12/23 for more details on this approach.
0.8%
15.1%
16.9%
1.5%
12.3%
0.0%
2.0%
4.0%
6.0%
8.0%
10.0%
12.0%
14.0%
16.0%
18.0%
INSURANCE WITH PROFIT
PARTICIPATION
IL AND UL INSURANCE OTHER LIFE INSURANCE ACCEPTED REINSURANCE TOTAL
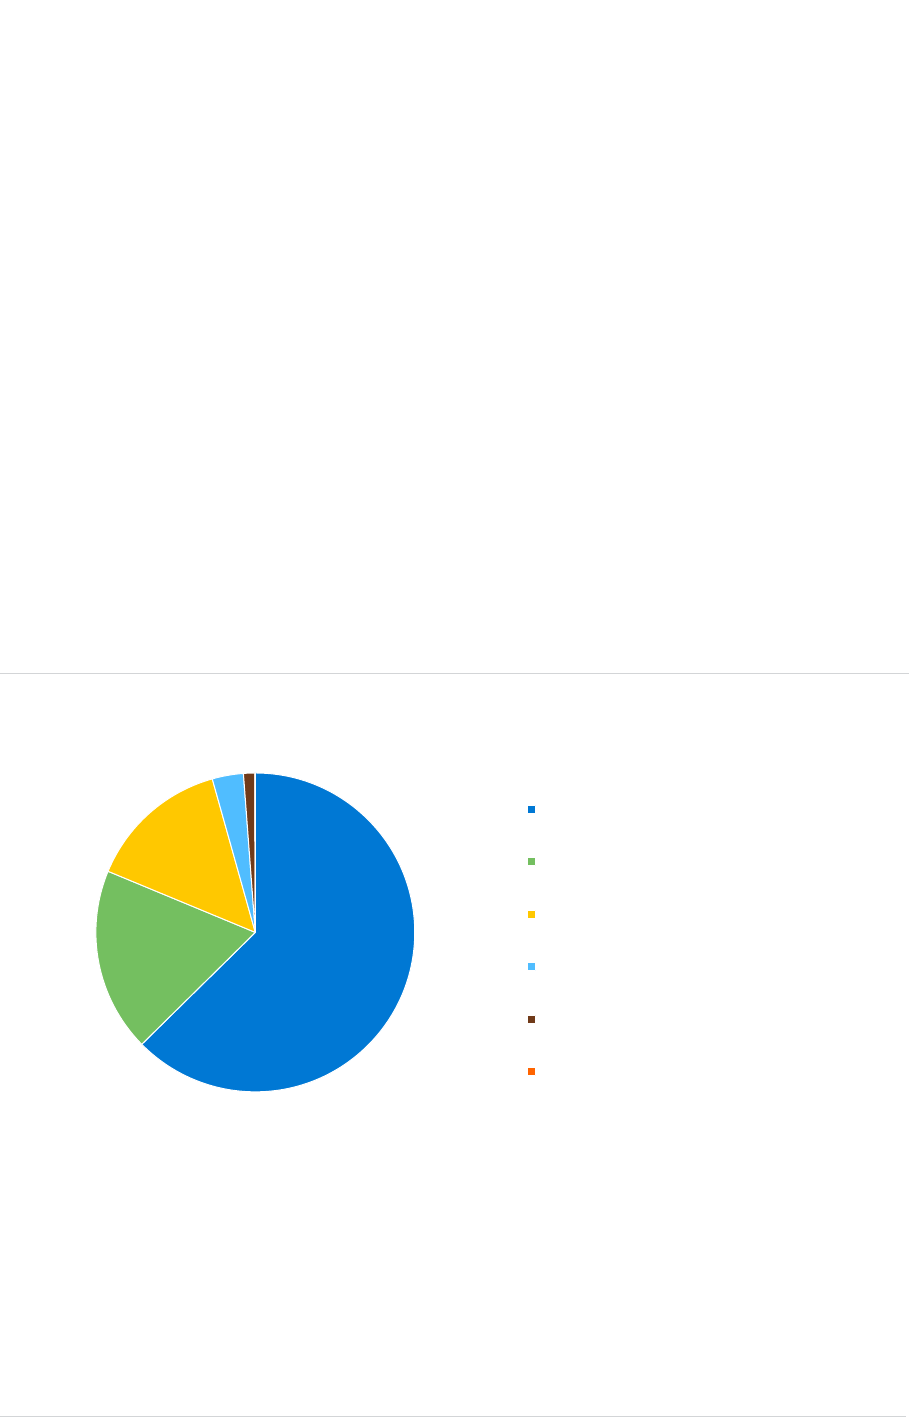
MILLIMAN RESEARCH REPORT
Analysis of life insurers’ solvency and 28 September 2023
financial condition reports year-end 2022
The line of business with the highest ceded
level of reinsurance is ‘Other Life Insurance’ at
16.9%. This category generally includes non-
linked annuities, and it is common practice to
reinsure the longevity risk associated to this
business. This is around 2% higher than the
second largest, which is ‘IL and UL Insurance’ at
15.1%, although due to the size of this market
the value of total recoverables for ‘IL and UL Insurance’ products is much higher than for ‘Other Life Insurance’ (£172
billion against £51 billion). The smallest percentage is 0.8% for ‘Insurance With Profit Participation’.
Reinsurance for ‘IL and UL Insurance’ in the UK can often be in respect of policyholders of one company
investing in the unit-linked funds of other firms, which has been established as a reinsurance arrangement.
The results for ‘Annuities (Stemming from Non-Life Insurance Contracts)’ have not been shown in Figure 21 for
readability, however, 58.7% of all liabilities have corresponding reinsurance recoverables. This suggests that
most firms reinsure the risks associated to these liabilities, which is perhaps unsurprising given their small
absolute value and that the liabilities can often be quite different from a firm’s other business.
Overall, the industry has reinsurance recoverables of around 12.3% across all life TPs. This is an increase of
0.9% on the proportion at year-end 2021 and suggests that there has been a small increase in the proportion of
UK life TPs that are reinsured relative to last year.
Analysis of premiums, claims and expenses
GROSS WRITTEN PREMIUMS
The largest share of the market for the UK companies in our sample is ‘IL and UL Insurance,’ making up 63% of
GWP in 2022.
FIGURE 22: SPLIT OF GROSS WRITTEN PREMIUMS BY LINE OF BUSINESS
The rest of the GWP is made up of 19% ‘Other Life Insurance,’ 14% ‘Life Reinsurance,’ 3% ‘Insurance with Profit
Participation,’ and just over 1% between ‘Health Insurance’ and ‘Health Reinsurance.’
63%
19%
14%
3%
IL AND UL INSURANCE
OTHER LIFE INSURANCE
LIFE REINSURANCE
INSURANCE WITH PROFIT PARTICIPATION
HEALTH INSURANCE
HEALTH REINSURANCE
Overall, the UK Life industry has
REINSURANCE RECOVERABLES
of around
12.3%
of total TPs
MILLIMAN RESEARCH REPORT
Analysis of life insurers’ solvency and 29 September 2023
financial condition reports year-end 2022
Due to the long-term nature of the life insurance business, the profile of the current book of business for many
companies may be quite different from the products currently sold.
The most notable difference when comparing the GWP in 2022 to the reported TPs at year-end 2022 is that only
3% of GWP is written in respect of ‘Insurance with Profit Participation’ whilst this line of business represents 11%
of total life TPs. This reflects the declining popularity of this type of business in the UK, however there was an
23% increase in the volume of GWP in respect of ‘Insurance with Profit
Participation’ in 2022 when compared to 2021. This follows a 46%
reduction from 2019 to 2020 and an 8% reduction from 2020 to 2021.
This ranking of the GWP by line of business has remained the same
since the year-end 2021 results, with ‘IL and UL Insurance’ decreasing
by one percentage point from 64%, ‘Other Life Insurance’ increasing by
one percentage point from 18%, ‘Life Reinsurance’ decreasing by one
percentage point from 15%, and ‘Insurance with Profit Participation’
increasing by one percentage point from 2% of the total GWP.
The total volume of GWP decreased by 5%, based on the companies in
the sample, from £227 billion (€270 billion) during 2021 to £216 billion
(€244 billion) during 2022.
Whilst most lines of business showed a decrease in GWP over the year, the largest absolute decrease was seen
in the ‘IL and UL Insurance’ category, decreasing by around £9 billion.
There are still a few insurers selling to overseas markets through their UK companies. Figure 23 shows a rough
breakdown of the cross-border sales by country for 2022.
FIGURE 23: CROSS-BORDER SALES BY COUNTRY BY GROSS WRITTEN PREMIUMS
88%
6%
3%
2%
0.3%
0.5%
IRELAND
POLAND
GERMANY
NETHERLANDS
SWEDEN
OTHER
GROSS WRITTEN
PREMIUMS
for life insurance have
DECREASED
over the year

MILLIMAN RESEARCH REPORT
Analysis of life insurers’ solvency and 30 September 2023
financial condition reports year-end 2022
Ireland accounts for the majority of cross-border sales from the UK
at 88%. The bulk of the remaining overseas sales are to Poland
(6%), Germany (3%), the Netherlands (2%) and Sweden (0.3%).
The rest of the countries with cross-border sales from the UK have
been categorised as ‘Other,’ which accounts for around 0.5% of the
total cross-border GWP.
This represents a significant change from what we have seen in
previous years, where Australia, South Korea and Japan have
accounted for a large proportion of cross-border GWP from the UK.
This has been as a result of Pacific Life Re dominating cross-border
GWP in previous years of the analysis, with Australia being their
largest target market for overseas sales from the UK. However, Pacific
Life Re redomiciled to Bermuda in 2022,
30
meaning that the company
is no longer in our sample of UK life (re)insurers, and hence does not
contribute to the cross-border GWP in Figure 23.
In 2021, Prudential Assurance Company (part of the M&G group) emerged as another company experiencing
high cross-border sales, contributing 56% of the entire cross-border GWP from our sample. This continued in
2022, with Prudential Assurance Company now contributing 97.2% of the total cross-border GWP from the UK.
These cross-border sales are predominantly made up of business written into Ireland (£735 million in 2022). The
cross-border sales are likely in part due to Future+, a new range of multi-asset smoothed funds which are
available to various European markets outside of the UK through partnership agreements.
Overall, the value of cross-border sales out of the UK in 2022 (£836 million) was approximately 10% lower than
that seen in 2021 (£927 million). This is primarily driven by the redomiciling of Pacific Life Re. The levels of cross-
border sales continue to be significantly lower than they were in previous years. For example, the volumes of
cross-border sales were £1.27 billion and £2.43 billion in 2018 and 2017 respectively.
This decline in cross-border sales relative to 2017 is primarily due to the UK’s exit from the EU and companies
taking measures to ensure that they can continue their business interests in the case of changes to passporting
arrangements. Companies have been setting up companies in other EU states, notably Ireland and Luxembourg,
and using these as hubs for their EU business. There may be further reductions in the volume of cross-border
sales out of the UK in the future as the remaining companies make this transition, with Pacific Life Re becoming
the latest company to redomicile from the UK, as noted above. However, the launch of new cross-border
business from the UK by Prudential Assurance Company may suggest a change in this trend.
The data for Figure 23 was produced using QRT S.05.02.01. This QRT was not publicly disclosed by all firms
covered in this report. Where QRT S.05.02.01 was not disclosed it has been assumed that the firm did not carry
out any cross-border sales during 2022.
INCURRED CLAIMS
Considering the split of the UK life insurance market by line of business according to claim volumes incurred in
2022, we see a very different picture compared to GWPs, with the largest share attributable to ‘Insurance with
Profit Participation,’ which makes up 67% of the market.
30
Howell, D. (January 2022). Update on corporate structure changes at Pacific Life Re. Retrieved on September 7, 2023 from
https://www.pacificlifere.com/content/dam/plre/Update_on_Corporate_Structure_changes_at_Pacific_Life_Re.pdf.
The value of
CROSS-BORDER
SALES
has
DECREASED
over the year

MILLIMAN RESEARCH REPORT
Analysis of life insurers’ solvency and 31 September 2023
financial condition reports year-end 2022
FIGURE 24: SPLIT OF CLAIMS INCURRED BY LINE OF BUSINESS
In addition, only 9% of the claims incurred reported by UK firms in 2022 were attributable to ‘IL and UL
Insurance,’ which is in stark contrast to the 63% of GWP that is classed under this line of business. This, in part,
could be due to the fact that withdrawals from UL pension policies are not classified as claims. The proportions of
claims incurred attributable to other lines of business are, meanwhile, relatively similar to the proportions of GWP.
The proportions of claims incurred under ‘Other Life Insurance,’ ‘Life Reinsurance’ and ‘Health Insurance’ were
13%, 10% and 1%, respectively, whilst the equivalent GWP proportions were 19%, 14% and 1%. The proportions
of both claims incurred and GWP under both the ‘Health Reinsurance’ and ‘Annuities’ lines of business were less
than 0.1%.
This analysis further suggests that the ‘IL and UL Insurance' market is growing in the UK, whilst the ‘Insurance
with Profit Participation’ market is declining due to low premium income and relatively high claims going out.
EXPENSES
When considering the total expenses incurred by UK firms in 2022, we see a similar level of dominance from the
‘IL and UL Insurance’ and ‘Other Life Insurance’ lines of business as was seen in the split of GWP and TPs. The
total proportion of expenses incurred attributed to these two lines of business in 2022 was 73%, whilst the total
proportion of GWP and TPs under these lines of business were 81% and 78%, respectively. However, unlike
GWP and TPs, ‘Other Life Insurance’ made up a higher proportion of expenses incurred in 2022, with an
absolute amount of £4.8 billion in comparison to £4.3 billion for ‘IL and UL Insurance.’
The absolute amount of expenses has remained relatively stable when compared to year-end 2021, falling by
around 4% from £13.0 billion to £12.4 billion. Total assets in the UK fell by around 13% over the same period.
This has therefore resulted in an increase to expenses as a percentage of assets (expense ratio) by around 10%,
increasing from 0.50% in 2021 to 0.55% in 2022. Expense ratios for the firms in our sample
31
ranged from 0.02%
to 47.5%. The firms with the largest expense ratios tend to be the smallest companies, in particular friendly
societies, with 9 out of 15 of the firms with the highest expense ratios being friendly societies. Similarly, the
largest firms in our sample in terms of assets tend to have much lower expense ratios, with the largest 12 firms in
terms of assets incurring expenses in 2021 which were less than 1% of their total assets.
Analysis of own funds
Figure 25 shows the split of own funds by tier for all UK life companies in our sample at year-end 2022.
31
Our sample for analysing firms’ expenses excludes firms which reported a zero or negative expense in the year.
9%
13%
10%
67%
IL AND UL INSURANCE
OTHER LIFE INSURANCE
LIFE REINSURANCE
INSURANCE WITH PROFIT PARTICIPATION
HEALTH INSURANCE
HEALTH REINSURANCE
ANNUITIES

MILLIMAN RESEARCH REPORT
Analysis of life insurers’ solvency and 32 September 2023
financial condition reports year-end 2022
FIGURE 25: SPLIT OF ELIGIBLE OWN FUNDS BY TIER
Figure 25 shows that the majority of capital for own funds is being
held in the highest quality, tier 1 unrestricted capital. Overall, 90%
of UK life insurers’ own funds are held in this highest quality
capital.
Tier 1 restricted capital and tier 2 capital make up 2% and 6% of
the total own funds, respectively. Tier 1 restricted and tier 2 are
used by only some of the companies in the sample, with the only four users
32
of restricted tier 1 capital
accounting for 100% of the total and the five largest users
33
of tier 2 capital accounting for around 85% of the
total. The types of companies which tend to hold tier 2 capital are generally the largest companies in the market
and the mono-line annuity providers. Tier 1 restricted and tier 2 capital are primarily made up of subordinated
debt, loan notes and preference shares.
There is a very small amount of tier 3 capital, which accounts for around 2% of the total. Overall, there was little
change in the split of own funds when compared to the year-end 2021 SFCRs.
Figure 26 shows the components of the own funds at year-end 2022.
32
The four users of restricted tier 1 own funds are Rothesay Life, Pensions Insurance Corporation, Just Retirement Limited and Partnership Life
Assurance Company.
33
The five largest users of tier 2 own funds are Scottish Widows, Pensions Insurance Corporation, Royal London, Rothesay Life and Just
Retirement Limited.
90%
2%
6%
2%
TIER 1 UNRESTRICTED
TIER 1 RESTRICTED
TIER 2
TIER 3
90% of own funds
for UK life insurers is held in
tier 1 unrestricted capital

MILLIMAN RESEARCH REPORT
Analysis of life insurers’ solvency and 33 September 2023
financial condition reports year-end 2022
FIGURE 26: COMPONENTS OF OWN FUNDS
Own funds within UK life insurers primarily consist of the ‘Reconciliation Reserve’ (49%) and ‘Share Capital'
(41%). Own funds in ‘Subordinated Liabilities' contributes 8% of the total. The majority of the ‘Subordinated
Liabilities’ for UK life insurers are categorised as restricted tier 1 or tier 2 capital which accounts for a comparable
proportion of the own funds (8% combined as noted above). 82% of the ‘Subordinated Liabilities’ held by UK life
insurers comes from only four firms.
34
As expected, the firms reporting significant usage of ‘Subordinated
Liabilities’ also report notable levels of restricted tier 1 and tier 2 own funds.
In the UK life market, ‘Deferred Tax Assets,’ ‘Ancillary Own Funds’ and ‘Other Basic Own Funds’ are all very
small, making up 2.6% of the entire own funds collectively.
The breakdown of the components has changed slightly relative to the year-end 2021 SFCRs, where the
‘Reconciliation Reserve’ was less than the ‘Share Capital’. For the year-end 2022 SFCRs, the opposite is true,
reverting to the profile previously seen at year-end 2020.
The breakdown of the ‘Reconciliation Reserve’ is also available from the SFCRs and is shown in the chart in
Figure 27. The ‘Reconciliation Reserve’ is constructed from the ‘Excess of Assets over Liabilities,’ with
deductions made for ‘Own Shares,’ ‘Foreseeable Dividends,’ ‘Other Basic Own Fund Items’ and ‘Adjustments'
(for restricted own funds items in respect of MA portfolios and ring-fenced funds).
34
The four firms with high levels of ‘Subordinated Liabilities’ are Pension Insurance Corporation, Rothesay Life, Scottish Widows and Royal
London.
49%
41%
8%
0.8%
0.3%
1.5%
RECONCILIATION RESERVE
SHARE CAPITAL
SUBORDINATED LIABILITIES
OTHER BASIC OWN FUNDS
ANCILLARY OWN FUNDS
DEFERRED TAX ASSETS

MILLIMAN RESEARCH REPORT
Analysis of life insurers’ solvency and 34 September 2023
financial condition reports year-end 2022
FIGURE 27: BREAKDOWN OF THE RECONCILIATION RESERVE
The breakdown of the Reconciliation Reserve is very similar to that observed from the year-end 2021 SFCRs,
including ‘Own Shares’ having zero impact on the Reconciliation Reserve. The Reconciliation Reserve itself fell
by 2.1% when compared to the figure as at year-end 2021. This was primarily driven by the total value of ‘Excess
Assets Over Liabilities’ decreasing by 10.4% over the year.
It is worth noting that the adjustment due to ‘Foreseeable Dividends’ is around 83% lower than the figure as at
year-end 2021 (£3.170 billion of foreseeable dividends were included at year-end 2021 compared to only £0.528
billion at year-end 2022). The large dividend figure seen in 2021 was likely driven by firms having deferred
dividends from 2020 following a recovery from the market uncertainty caused by the COVID-19 pandemic.
Analysis of solvency coverage
The weighted average SCR coverage ratio for our sample of UK life insurers from the year-end 2022 SFCRs was
189%, based on figures from companies’ public QRTs. This is well in excess of the 100% coverage required,
showing that most companies are choosing to hold excess capital to provide security and stability. This is,
however, noticeably lower than the European average in our sample of 244%, suggesting that UK insurers on
average hold less excess capital, in percentage terms, than their counterparts across Europe.
The European average is being driven up by the high solvency coverage resulting from the high impact of the
LTGMs in the German market. This is consistent with what was seen in the previous set of SFCRs, where the
average SCR coverage ratio for the UK was 162% and across Europe was 240%.
Figure 28 compares the UK to the European average solvency coverage ratios.
FIGURE 28: AVERAGE SCR AND MCR COVERAGE RATIOS
UK
AVERAGE
EUROPEAN
AVERAGE
RATIO OF ELIGIBLE OWN FUNDS TO SCR
189%
244%
RATIO OF ELIGIBLE OWN FUNDS TO MCR
601%
634%
MCR AS A % OF THE SCR
29%
36%
£-
£10
£20
£30
£40
£50
£60
£70
£80
£90
£100
£110
£120
£130
EXCESS OF ASSETS
OVER LIABILITIES
OWN SHARES FORESEEABLE
DIVIDENDS
OTHER BASIC OWN
FUND ITEMS
ADJUSTMENTS RECONCILIATION
RESERVE
Billions
THE WEIGHTED AVERAGE
SCR COVERAGE RATIO
for UK life insurers was
189%
which is lower than the
EU Average of
244%
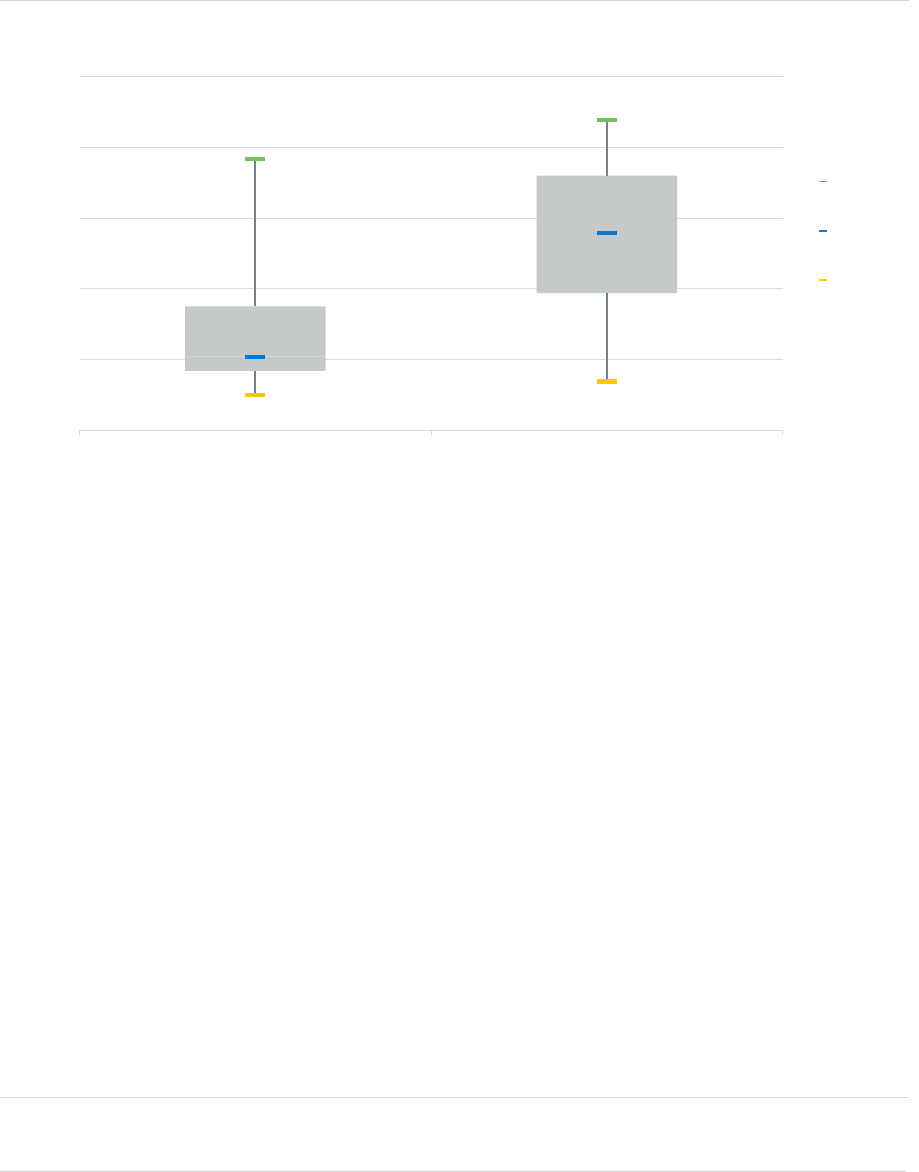
MILLIMAN RESEARCH REPORT
Analysis of life insurers’ solvency and 35 September 2023
financial condition reports year-end 2022
The weighted average MCR coverage ratio for UK life insurance companies was 601%. This is a very high ratio
and shows that the MCR is very small compared to the level of capital which insurers are actually holding. It is
again lower than the European average of 634%.
The weighted average MCR as a percentage of the SCR was 29% for the UK. This indicates that for the average
company, the linear MCR is calculated within the limits of 25% to 45% of the SCR, i.e., that the cap or floor is not
biting for all companies, but that it is likely that the floor of 25% is biting for many companies. The weighted
average MCR as a percentage of SCR has remained similar to that seen at year-end 2021.
The distribution of the SCR and MCR ratios is shown in Figure 29.
FIGURE 29: DISTRIBUTION OF AVERAGE SCR AND MCR COVERAGE RATIOS
The SCR coverage ratios for UK life insurers are displayed in the box-and-whisker diagramme in Figure 29. The
solvency coverage has a range covering 100% to 4,051% for the companies in the sample. It should be noted
that the nine companies with SCR coverage ratios of 1,000% or greater have been removed from the diagramme
to make it more readable. Half of the companies have an SCR coverage ratio that falls between 169% and 351%
(the interquartile range of the distribution). This is a reasonably narrow range considering the overall spread of
coverage ratios. However, it is also notable that the upper quartile makes up almost the entirety of the range
(209% to 351%). The interquartile range is, however, wider than seen in the year-end 2021 results, where half of
all companies had an SCR coverage ratio between 155% and 251%.
The MCR coverage ratio has a range which is narrower in size than the SCR coverage ratio (139% to 2,420%).
However, this has been limited to 1,000% in the chart for readability. It has a higher minimum and a lower
maximum
35
than the range for SCR coverage ratios. Half of the companies have an MCR coverage ratio that falls
between 389% and 720%, which is a larger interquartile range than shown by the SCRs, suggesting more
variability amongst firms in the MCR coverage ratio than the SCR coverage ratio. This is likely driven by the
majority of firms managing their business with respect to the SCR and making business decisions based on the
impact on the SCR coverage ratio.
The distribution of the SCR coverage ratios has not changed significantly since the year-end 2021 SFCRs with
the biggest difference being the maximum SCR ratio growing significantly from 2,941% to 4,051%. The company
with the highest solvency coverage at year-end 2021 was Standard Life Pension Funds, whilst the company with
the highest at year-end 2022 was Railway Enginemen's Assurance Society Limited. Railway Enginemen’s saw a
large reduction to an already low SCR over the year, driven by a large increase to their loss absorbing capacity of
technical provisions, hence the large increase to their SCR coverage ratio.
35
This is because the firm with the highest SCR coverage ratio had an SCR lower than the absolute minimum floor on the MCR, hence their MCR
coverage ratio was lower than their SCR coverage ratio.
0%
200%
400%
600%
800%
1000%
SCR MCR
MAXIMUM
MEDIAN
MINIMUM

MILLIMAN RESEARCH REPORT
Analysis of life insurers’ solvency and 36 September 2023
financial condition reports year-end 2022
The minimum SCR coverage ratio was 100% at both year-end 2022 and year-end 2021 with both being reported
by the same firm, Exeter Friendly Society. This is due to Exeter Friendly Society own funds being restricted due
to ring-fenced fund restrictions such that the company’s own funds equal its SCR.
The range of MCR coverage ratios shows a similar range relative to the year-end 2021 results (199% to 2,070%). Out
of the 66 firms included in our analysis at year-end 2022, 11 firms report an MCR that is higher than the SCR, i.e., the
MCR is the biting constraint on their solvency requirements. In all instances this occurs where the SCR is very small
and has decreased below the absolute minimum capital requirement (AMCR) of £3.4 million (€4.0 million). The PRA
increased the AMCR relative to the value at year-end 2021 (previously £3.1 million, €3.7 million).
Several UK life insurers use either PIMs or FIMs. Of the 66 insurers in our analysis, there are eight PIM users
and 11 FIM users, with the remaining 47 using the Standard Formula. This reflects a small change in the number
of firms using the Standard Formula and PIMs in our sample relative to year-end 2021, where nine firms used a
PIM and 48 used the Standard Formula. This is driven by one firm who used the PIM no longer being in our
sample (Pacific Life Re), three other firms no longer in our sample who used the Standard Formula, and two new
firms in our sample who use the Standard Formula.
The table in Figure 30 shows the average SCR coverage ratio for companies aggregated by their SCR
methodologies (Standard Formula, PIM and FIM) at year-end 2022.
FIGURE 30: AVERAGE SCR FOR STANDARD FORMULA, PARTIAL INTERNAL MODEL AND FULL INTERNAL MODEL FIRMS
SCR COVERAGE RATIO
SF FIRMS
167%
PIM FIRMS
208%
FIM FIRMS
175%
The weighted average SCR coverage ratio for companies using the Standard Formula is 167%, whilst the ratio
for PIM and FIM firms is 208% and 175%, respectively. The ranking of SCR coverage ratio by type of model is in
line with that seen at year-end 2021, with companies using a PIM having the highest solvency coverage ratio at
173%, companies using the Standard Formula having the lowest solvency coverage ratio at 149%, and
companies using a FIM averaging 155%. The increases to the weighted average SCR coverage ratios of firms
using each type of SCR methodology have been driven by a large decrease to the SCRs, but a lower relative
decrease in the own funds. The decrease in the SCRs is likely to have been driven predominantly by the sharp
increase in interest rates over 2022 that have led to reductions in both the amounts of assets and liabilities on
firms’ balance sheets. Therefore, when these lower liabilities are put under the various stressed scenarios which
are used to calculate the SCR, this results in a lower difference in net assets, and hence a lower overall SCR.
The distribution of the SCR coverage ratios for each of the three different methodologies shows greater
differences between them. Figure 31 shows the distributions at year-end 2022.
Of our sample of UK Life Firms:
47 use the STANDARD FORMULA
8 use a PARTIAL INTERNAL MODEL
11 use a FULL INTERNAL MODEL

MILLIMAN RESEARCH REPORT
Analysis of life insurers’ solvency and 37 September 2023
financial condition reports year-end 2022
FIGURE 31: DISTRIBUTION OF SCR FOR INTERNAL MODEL FIRMS VERSUS STANDARD FORMULA
36
The SCRs for internal model firms have typically shown a smaller range than the Standard Formula firms. Many
of the companies using a PIM or FIM in our sample tend to be part of a group and the result suggests that
companies within a group manage their capital more actively and do not hold significant surplus capital at the
subsidiary level. This could also be driven by the small number of internal model firms (19 firms) in our sample.
Other FIM firms in our sample tend to be larger and more specialised in the products they offer and business they
sell, e.g., mono-line annuity companies. These are not necessarily a group and so may not manage capital as
actively, but their size means they will be higher up the PRA’s categories and their specialist nature may make it
more appropriate for them to use a FIM compared to the Standard Formula that is supposed to represent a
‘typical’ insurer.
The distribution of the SCR coverage ratios is reasonably similar to that seen in the year-end 2021 SFCRs. This
similar distribution of SCR coverage in comparison to last year is further evidenced in Figure 32 below, which
shows a plot of the solvency coverage reported at year-end 2022 versus that reported for year-end 2021.
36
The scale has been amended to only reach 1,000% coverage ratio for readability. This limit on the scale excludes eight Standard Formula firms
(Aviva Investors Pensions, BlackRock Life, Churchill Insurance, Liverpool Victoria Life Company, London General Life Company, Railway
Enginemen’s, ReAssure Life, and abrdn Life and Pensions) and one FIM firm (Standard Life Pensions Funds).
0%
100%
200%
300%
400%
500%
600%
700%
800%
900%
1000%
STANDARD FORMULA PARTIAL INTERNAL
MODEL
FULL INTERNAL MODEL ALL FIRMS
MINIMUM MEDIAN MAX
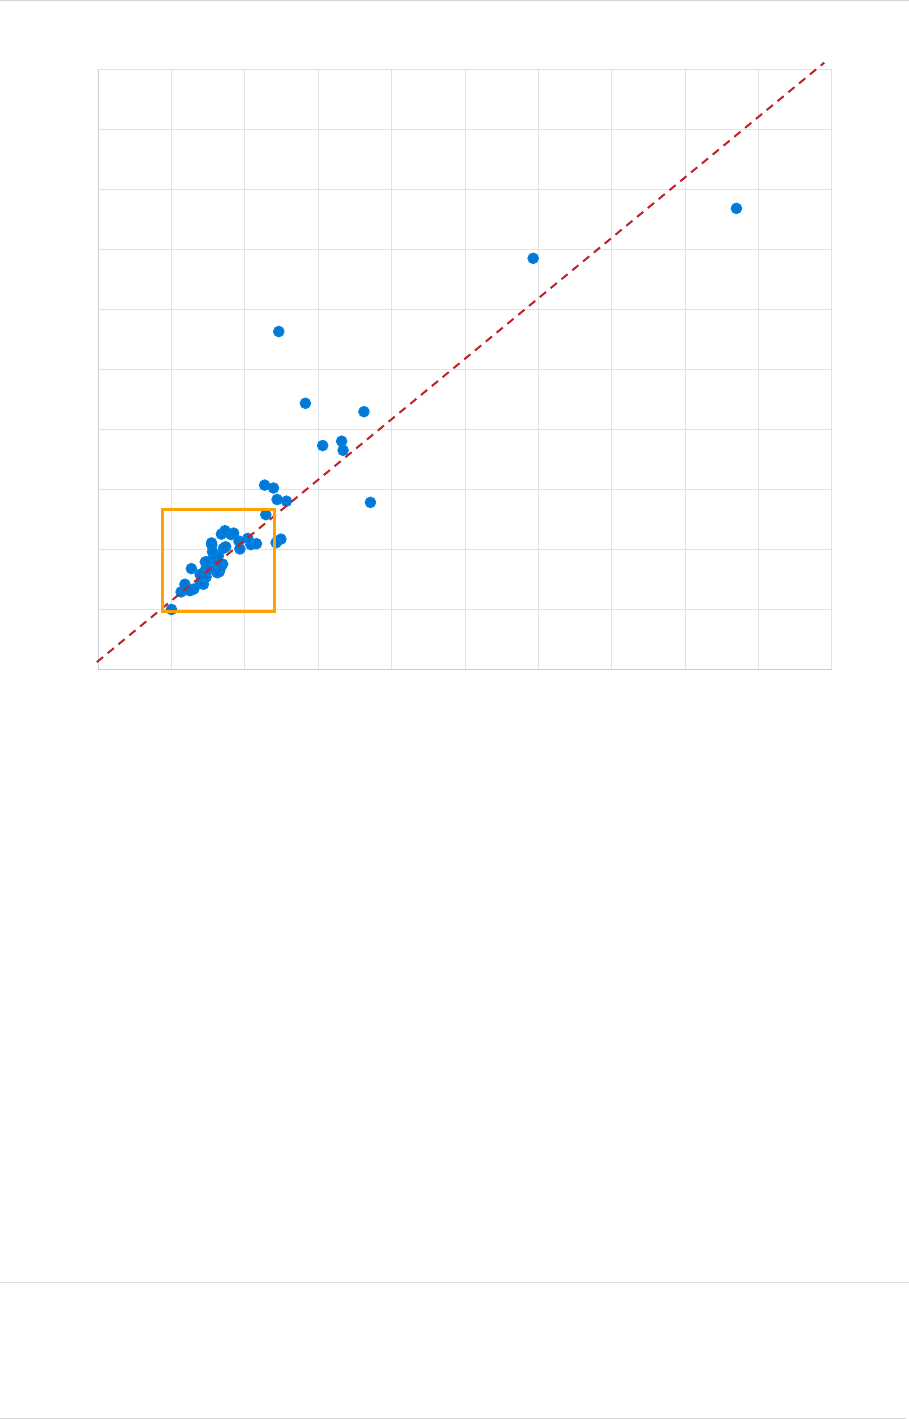
MILLIMAN RESEARCH REPORT
Analysis of life insurers’ solvency and 38 September 2023
financial condition reports year-end 2022
FIGURE 32: COMPARISON OF SCR COVERAGE (YEAR-END 2022 VS YEAR-END 2021)
37
Each blue dot represents one firm in the analysis plotted to show its year-end 2021 SCR coverage ratio on the x-
axis and its year-end 2022 SCR coverage ratio on the y-axis. The blue dots above the red dotted line represent
firms reporting a higher SCR coverage ratio at year-end 2022 than at year-end 2021, whilst those that fall below
the red dotted line represent firms reporting a lower SCR coverage ratio at year-end 2022 than at year-end 2021.
The red dotted line represents the point of ‘no change,’ i.e., dots which fall exactly on the line show no change in
their SCR coverage ratio between year-end 2022 and year-end 2021.
Most of the dots fall on or reasonably close to the ‘no change’ line, which suggests that the majority of firms did
not see a significant movement in their SCR coverage ratio over the year. In particular, a number of firms are
clustered in and around the 150% mark (highlighted by the yellow box) showcasing that many firms look to be
managing their SCR coverage ratio at this sort of level.
In comparison to changes observed last year, the solvency coverage ratios have been slightly less stable. The
maximum absolute change in SCR coverage between 2021 and 2022 was 317% (141% between 2020 and
2021) and the average absolute change between 2021 and 2022 was 37% (20% between 2020 and 2021).
38
37
The chart excludes coverage ratios more than 1,000% for readability. The chart also excludes any firms which were only included in our sample
at year-end 2021 or at year-end 2020 but not at both.
38
These figures only consider companies shown on the chart, i.e., they exclude any companies with a coverage ratio in excess of 1,000% in
either year as well as only comparing companies that were in both years’ analysis. This excludes a few large movements where the change in
SCR coverage ratio is high, but the absolute change in SCR and own funds is very small.
0%
100%
200%
300%
400%
500%
600%
700%
800%
900%
1000%
0% 100% 200% 300% 400% 500% 600% 700% 800% 900% 1000%
Solvency Coverage 2022
Solvency Coverage 2021
SOLVENCY COVERAGE HAS RISEN
SOLVENCY COVERAGE HAS FALLEN
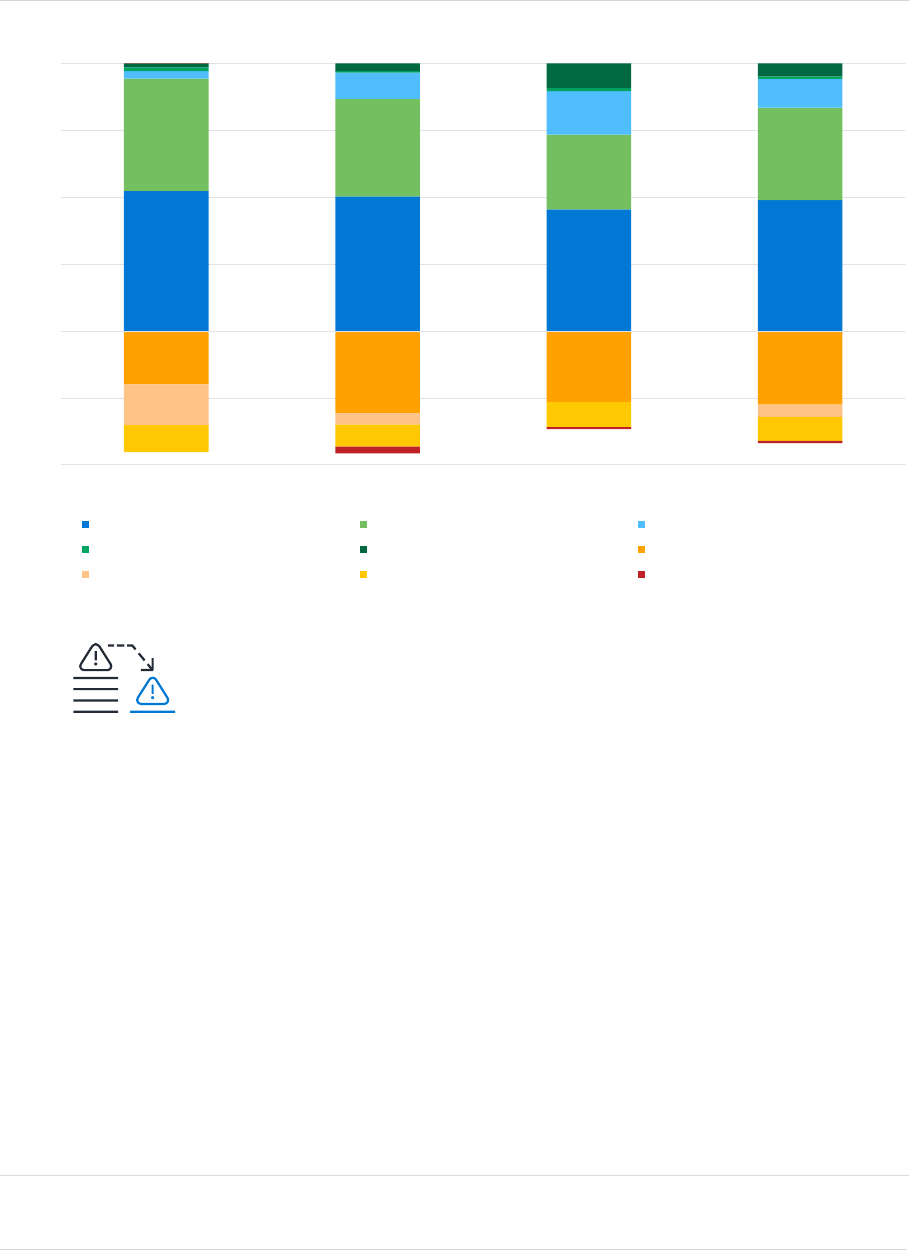
MILLIMAN RESEARCH REPORT
Analysis of life insurers’ solvency and 39 September 2023
financial condition reports year-end 2022
Analysis of SCR
We analysed the various SCR components for companies using the Standard Formula, a PIM or a FIM, along with the
sample of companies as a whole, to calculate the average contribution to the SCR for each sub-module at year-end
2022. For firms using a PIM or FIM, we have mapped the capital requirements to the Standard Formula risks, where
possible.
FIGURE 33: AVERAGE SCR BREAKDOWN OF SCR BY SF, PIM AND FIM
39
Figure 33 shows that life insurers in the UK are primarily exposed to market risk, contributing 52% of the
undiversified SCR for Standard Formula firms, 50% for PIM firms and 45% for FIM firms. Market risk contributes
49% to the undiversified SCR on average across all companies included in our sample.
Underwriting risk for UK life insurers contributes 42%, 36% and 28% of the undiversified SCR for Standard
Formula, PIM and FIM firms, respectively, with the vast majority coming from life underwriting risk. The remainder
of the underwriting risk comes from health underwriting risk from health insurance provided by UK life insurers
and non-life underwriting risk from the composite firms included in this analysis (which have a majority of life
insurance business). Underwriting risk contributes 34% to the undiversified SCR on average across all firms in
our sample (with 31 percentage points coming from life underwriting risk).
Counterparty default risk is the only other risk which contributes to the basic solvency capital requirement
(BSCR). It makes up only 2%, 3% and 9% of the undiversified SCR for Standard Formula, PIM and FIM firms,
respectively, implying that it is not as significant as either market risk or underwriting risk.
39
The amounts within this figure are as a percentage of the total of the capital requirement for each risk module including operational risk (the
undiversified SCR). Each element has been calculated as the sum across the companies for a specific SCR calculation method.
-50%
-25%
0%
25%
50%
75%
100%
STANDARD FORMULA PARTIAL INTERNAL MODEL FULL INTERNAL MODEL ALL FIRMS
MARKET RISK U/W RISK OP RISK
OTHER (+) COUNTERPARTY DEFAULT RISK DIVERSIFICATION
LACTP LACDT OTHER (-)
MARKET RISK is the largest risk to UK life insurers,
contributing 49%
of the undiversified SCR

MILLIMAN RESEARCH REPORT
Analysis of life insurers’ solvency and 40 September 2023
financial condition reports year-end 2022
Operational risk only contributes 3% to the undiversified SCR for Standard Formula firms but adds 10% and 16%,
respectively, to PIM and FIM firms. This result is not unexpected, as operational risk is often included within
internal models when companies decide that the factor-based approach prescribed by the Standard Formula
does not appropriately reflect their risk exposures. It may also reflect that other risks such as market or
underwriting risks are smaller relative to Standard Formula firms, due to closer management of these risks,
different calibration of the stresses or diversification under the PIM/FIM. A similar argument could be provided for
why counterparty default risk is higher for FIM and PIM firms when compared to Standard Formula firms.
The diversification benefit for the UK life insurance market is large, giving a reduction of 20% of the undiversified
SCR for Standard Formula firms, 31% for PIM firms and 27% for FIM firms. This is the diversification between the
risk modules in building up the BSCR
40
and not between the various sub-modules within the risk modules. The
higher diversification benefits for PIM and FIM firms suggest a departure from the Standard Formula method of
aggregation, thus increasing the ability of the different risks to offset one another.
Other adjustments have been split into net increases and net decreases to the SCR. Net increases, ‘Other (+),’
41
contributes 1% of the undiversified SCR across all companies, whilst net decreases, ‘Other (-),’ gives a reduction
of 1% of the undiversified SCR across all companies. Other adjustments include capital add-ons already set,
adjustments due to ring-fenced funds and additional capital requirements for the business.
In addition to diversification benefits, adjustments are made for LACTP and LACDT. The published results show
that UK insurers are utilising the LACTP adjustment, resulting in an average reduction of 5% of the undiversified
SCR across all firms. There are only 21 insurers using the adjustment, with four insurers (Royal London Mutual
Insurance Society, Wesleyan Assurance Society, ReAssure Limited and Liverpool Victoria Friendly Society)
accounting for approximately 90% of the entire LACTP of UK life insurers between them. Only two insurers using
the LACTP adjustment do not use the Standard Formula, both using a PIM.
42
The LACTP gives a reduction of
15% to Standard Formula firms (16% at year-end 2021) and 4% to the undiversified SCR for PIM firms (4% at
year-end 2021). The reduction as a result of LACTP is lower than shown for individual firms as this impact is
shown across the full set of companies in our analysis, i.e., including firms that do not make use of the
adjustment and so in effect have a reduction from a LACTP of 0%.
There are 39 companies using the LACDT adjustment, approximately 60% of the firms in our sample, which
allows a reduction of 9% of the undiversified SCR for the UK life insurance industry. The LACDT gives a
reduction from the undiversified SCR of 10% to Standard Formula firms (9% at year-end 2021), 8% to PIM firms
(8% at year-end 2021) and 9% to FIM firms (10% at year-end 2021) reflecting a relatively similar level of LACDT
adjustment across the market as at year-end 2021.
Of the 39 firms in our sample using the LACDT adjustment, 34 of these provided a breakdown of the justification
of their LACDT, and furthermore 27 of these reported their maximum permissible LACDT. The maximum LACDT
is broadly calculated as the sum of the BSCR, the LACTP and the Operational Risk SCR, multiplied by the
applicable tax rate. The LACDT can then be justified by a combination of the four following categories:
Reversion of deferred tax liabilities
Reference to probable future taxable economic profit
Carry back, current year
Carry back, future years
The first category refers to firms taking credit for net deferred tax liabilities which have already been recognised on the
Solvency II balance sheet. The third and fourth refer to carrying back losses to previous fiscal years (which, depending
on the timing and duration of the loss incurred from a stress, may be attributable to the current year or future years).
The second refers to taking credit for the creation of a notional deferred tax asset as a result of the maximum LACDT
exceeding the justification from the other three categories. This can only be taken credit for, provided firms can justify
that there are adequate expected future profits on which future tax would be payable.
40
The BSCR in our analysis excludes operational risk. The operational risk module for Standard Formula firms is not diversified with the other risk
modules, however, the operational risk for PIM and FIM firms may be diversified with the other risk modules. We have excluded the operational
risk from our calculations of BSCR for all firms for consistency.
41
‘Other (+)’ includes risks from internal model firms which did not map clearly onto the risk modules of the standard formula.
42
The PIM firms using LACTP are Royal London Mutual Insurance Society and AEGON Scottish Equitable.

MILLIMAN RESEARCH REPORT
Analysis of life insurers’ solvency and 41 September 2023
financial condition reports year-end 2022
Figure 34 below shows the split of the LACDT justification into each of these categories, separated into SCR
calculation method.
FIGURE 34: SPLIT OF LACDT JUSTIFICATION BY SCR CALCULATION METHOD
Figure 34 shows that PIM and FIM firms are much heavier users of the justification by reference to probable future
taxable profit than those firms using the Standard Formula. Standard Formula firms are mostly reliant on justification by
reversion of deferred tax liabilities. This is perhaps unsurprising given that this probably the most straightforward
method of justification.
Of the 27 firms which reported their maximum permissible LACDT figure, 14 were able to fully justify this
maximum amount. Across all firms the weighted average proportion of the maximum LACDT that was justified
was 82%, i.e., there was a further 18% of the maximum permissible LACDT which firms could benefit from if they
were able to justify its use.
Analysis of MCR
The MCR is the ultimate level of supervisory intervention. Where this is breached the regulator will intervene and
has the power to restrict the activities of the firm. The calculation of the MCR is formulaic and carried out in a
similar way for all firms (regardless of whether the firm uses the Standard Formula, a PIM or FIM to calculate its
SCR).
The MCR is calculated using a linear formula (Linear MCR), subject to a cap and a floor with two conditions.
These restrictions are:
A cap of 45% of the SCR
A floor of 25% of the SCR
An absolute minimum capital requirement (AMCR) of £3.1 million (€3.7 million) for life insurers
43
43
The amount is prescribed by the Solvency II regulation. The amount for non-life and composite firms differs.
0%
10%
20%
30%
40%
50%
60%
70%
80%
90%
100%
STANDARD
FORMULA
PARTIAL INTERNAL
MODEL
FULL INTERNAL
MODEL
ALL FIRMS
LACDT JUSTIFIED BY CARRY
BACK, FUTURE YEARS
LACDT JUSTIFIED BY CARRY
BACK, CURRENT YEAR
LACDT JUSTIFIED BY
REFERENCE TO PROBABLE
FUTURE TAXABLE ECONOMIC
PROFIT
LACDT JUSTIFIED BY REVERSION
OF DEFERRED TAX LIABILITIES
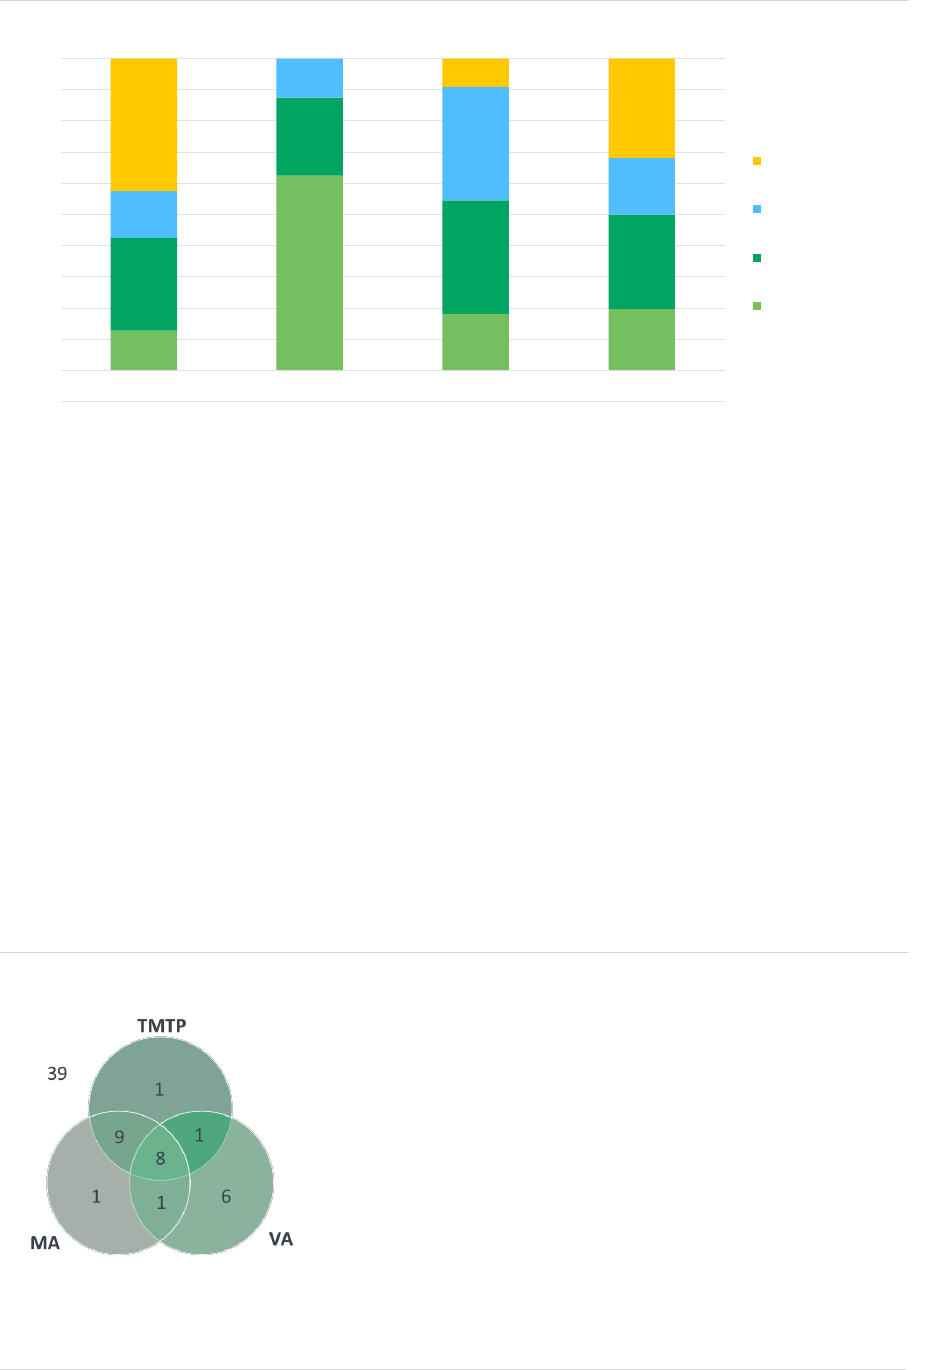
MILLIMAN RESEARCH REPORT
Analysis of life insurers’ solvency and 42 September 2023
financial condition reports year-end 2022
Figure 35 below shows what proportion of firms see each of the conditions for the MCR calculation bite.
FIGURE 35: BITING CONDITION OF THE MCR
Despite appearing as a core part of the calculation, the Linear MCR bites for very few firms (20% of all firms),
however this proportion is notably higher for PIM firms (63%).
The most common biting condition is the AMCR, which bites for 32% of all firms. This represents a change from
last year, where the most common biting condition was the 25% floor, biting for 43% of all firms at year-end 2021.
The AMCR being the biting condition generally occurs when the absolute value of the SCR is small, and it is
therefore unsurprising that the dominant SCR methodology used by firms for which the AMCR bites are firms that
use the Standard Formula. Of the 21 firms for which the AMCR is the biting condition, 20 of these use the
Standard Formula to calculate their SCR. Also, 11 of these 21 firms have an MCR in excess of the SCR, i.e., the
MCR is the overall biting constraint for the firms’ capital requirements.
The 25% cap bites for 30% of firms, whilst the 45% cap bites for 18% of firms. The majority of firms where the
45% cap bites have significant proportions of their business as ‘IL and UL Insurance.’
Long-term guarantee measures
A significant number of UK life insurers use the LTGMs included in the analysis for this report.
Of the companies in our sample, 16 are using the VA, 19 are using the MA and 19 are using the TMTP at year-
end 2022, with some companies using combinations of the LTGMs as shown in the Venn diagram in Figure 36.
Of the UK life companies in our sample, 39 did not use any of the LTGMs.
FIGURE 36: NUMBER OF COMPANIES USING LONG-TERM GUARANTEE MEASURES
-10%
0%
10%
20%
30%
40%
50%
60%
70%
80%
90%
100%
STANDARD FORMULA PARTIAL INTERNAL
MODEL
FULL INTERNAL MODEL ALL FIRMS
AMCR
45% SCR CAP
25% SCR FLOOR
LINEAR MCR
Of our sample of UK Life Firms:
16 used the VOLATILITY ADJUSTMENT
19 used the MATCHING ADJUSTMENT
19 used the TMTP
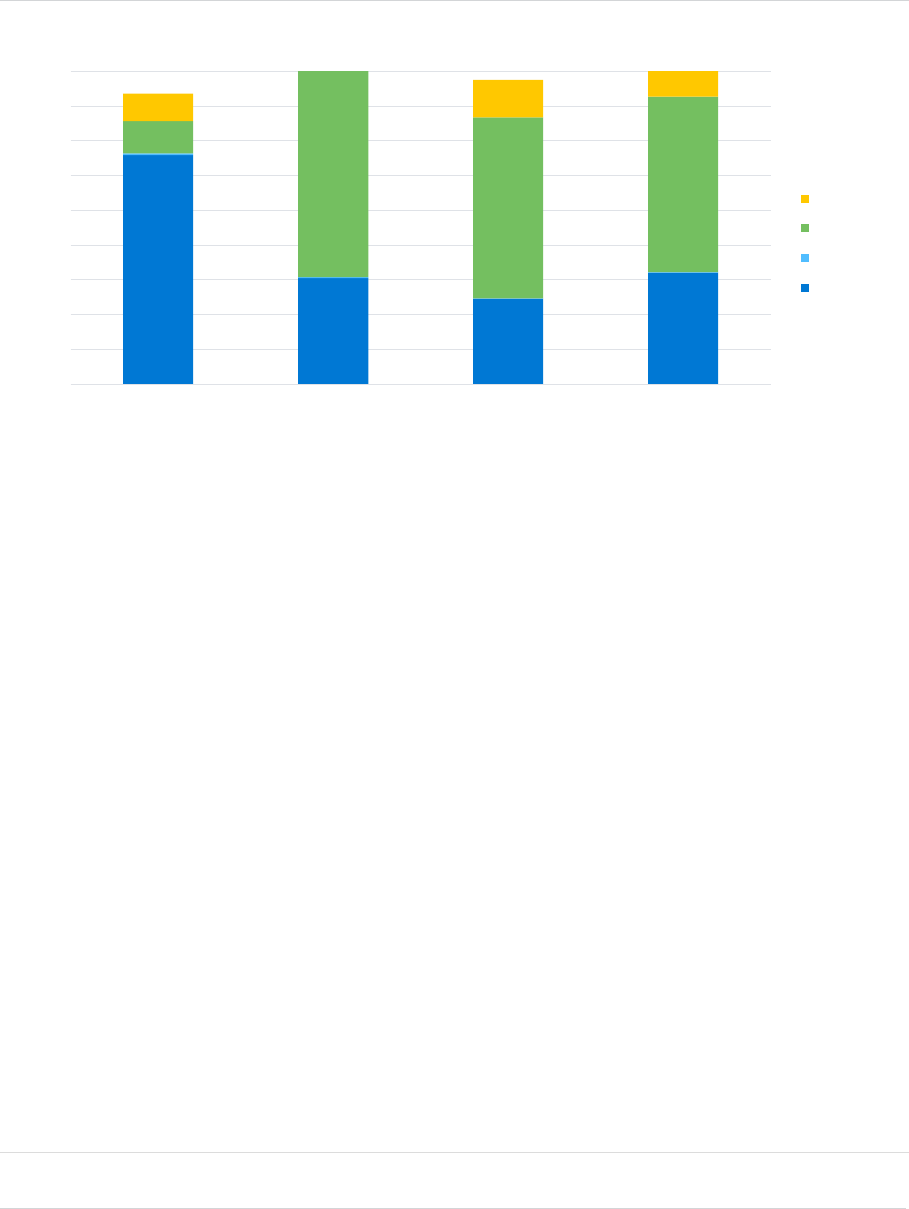
MILLIMAN RESEARCH REPORT
Analysis of life insurers’ solvency and 43 September 2023
financial condition reports year-end 2022
There has not been any movement in the use of LTGMs in the UK since year-end 2021, however we do note that
a number of firms which have approval for the use of the TMTP reported that the impact on both the Eligible Own
Funds and the SCR at year-end 2022 was nil. These firms still contribute to the 19 firms counted in our sample
as using the TMTP.
Figure 37 shows the breakdown of the SCR coverage ratio by each LTGM and the result if no LTGMs were applied at
year-end 2022. The breakdown is shown for Standard Formula, PIM and FIM firms, alongside the total across all
companies.
FIGURE 37: BREAKDOWN OF SCR COVERAGE RATIO BY LONG-TERM GUARANTEE MEASURE
The general picture seen in Figure 37 is that companies using PIMs and FIMs have similarly high levels of reliance on
LTGMs, and this drives the aggregate result for all firms, as, in general, the companies using PIMs and FIMs tend to be
the largest companies. Companies using the Standard Formula in general have lower levels of reliance on LTGMs.
The MA makes up the largest proportion of the SCR coverage ratios for FIM and PIM firms, on average
accounting for 101 percentage points of the total SCR coverage ratio for life insurers in the UK. This is highest for
the PIM firms at 119 percentage points. A number of the companies using a FIM or PIM are the mono-line
annuity providers. Annuity business is one of the primary business areas eligible for the MA which is why the
benefit of the MA is so material for the mono-line annuity firms. The MA is one of the key areas under review as
part of the UK Review of Solvency II
44
and so the relative size of the MA benefit could change in the future.
The TMTP is the next-largest LTGM, adding on average 23% to the solvency coverage ratio across all
companies. The TMTP has proven to be popular in the UK, especially amongst annuity providers, primarily
because of the relatively high RM for annuity business compared to other business. The level of benefit provided
by the TMTP has reduced from 31% since year-end 2021. This is mostly driven by a few firms in our sample that
use the TMTP stating that the impact on both Eligible Own Funds and the SCR as at year-end 2022 was nil due
to the large increase in risk-free rates over the year. The TMTP is designed to run off over time, so this reduction
also partly reflects the expected run-off of the TMTP over time alongside any additional recalculation of the
TMTP. Recalculation of the TMTP is required at least biennially by the PRA. Firms which make use of the TMTP
will likely need to recalculate this following any change implemented as a result of the UK Review of Solvency II,
in particular given that the RM and MA changes being proposed likely to have a knock on impact on the size of
the TMTP. The calculation of the TMTP itself is also under consideration as part of the review.
The VA has the lowest impact across all categories, with an impact of less than 1% on PIM and FIM firms and
just over 1% on Standard Formula firms. On average, it contributes around 0.4% to the SCR coverage ratio
across all companies. This is similar to the VA impact shown in the year-end 2021 SFCR.
44
See the Milliman paper on the PRA’s CP12/23 for more details on the UK review of Solvency II.
0%
20%
40%
60%
80%
100%
120%
140%
160%
180%
STANDARD FORMULA PARTIAL INTERNAL
MODEL
FULL INTERNAL MODEL ALL FIRMS
TMTP
MA
VA
NO LTGM

MILLIMAN RESEARCH REPORT
Analysis of life insurers’ solvency and 44 September 2023
financial condition reports year-end 2022
The solvency coverage ratio without the LTGM has increased from 51% at year-end 2021 to 64% at year-end
2022. This is mainly driven by a 20 percentage point increase in pre-LTGM solvency coverage ratios for Standard
Formula firms (increasing from 112% at year-end 2021 to 132% at year-end 2022, indicating that Standard
Formula firms, on average, remain solvent without the application of the LTGMs) and an 18 percentage point
increase for PIM firms (increasing from 43% at year-end 2021 to 61% at year-end 2022). Similarly, FIM firms
have seen their pre-LTGM solvency ratios increase over the year from 45% at year-end 2021 to 49% at year-end
2022.
Conclusion
UK life insurers disclosed healthy results in the year-end 2022 SFCRs,
with an average SCR coverage ratio of 189%. No UK insurers in this
report had a coverage ratio of less than 100%, but some had extremely
high ratios, depending on a wide range of factors.
The matching adjustment (MA), the transitional measure on
technical provisions (TMTP) and the volatility adjustment (VA)
continue to be popular in the UK, although the impact that the latter
has on UK firms’ solvency ratios is still minimal. The LTGMs lead to
significant increases in the SCR coverage ratio for some companies.
The analysis of the SFCRs shows that there has been little change to UK life insurers’ balance sheets relative to
year-end 2021.
‘IL and UL Insurance’ business continues to be the dominant product grouping for UK life insurers, when
measured by volume of TPs, reinsurance ceded and gross written premiums, continuing a trend observed in past
years. ‘Insurance with Profit Participation’ continues to decline when measured by volume of TPs, although saw
an increase in gross written premiums since year-end 2021.
The volume of gross written premiums sold by UK life insurers has decreased over the year, which could be
attributed to higher inflation rates leading to lower demand for life insurance products. However, the fall in GWP
was only slight, falling by 5% from £227 billion in 2021 to £216 billion in 2022.
Own funds are primarily held in tier 1 unrestricted own funds (90%), which is the highest form of capital in terms
of quality and loss absorbency as defined under Solvency II. Lower levels of capital are primarily only held by the
largest companies and mono-line annuity providers.
The most significant risks to UK life insurers continue to be market risk and underwriting risk, which is consistent
with what is being seen across Europe. LACTP and LACDT both benefit a number of UK companies significantly
when calculating their SCR.
Milliman is among the world’s largest providers of actuarial, risk
management, and technology solutions. Our consulting and
advanced analytics capabilities encompass healthcare, property &
casualty insurance, life insurance and financial services, and
employee benefits. Founded in 1947, Milliman is an independent
firm with offices in major cities around the globe.
milliman.com
UK life insurers have
an
average
SCR coverage ratio of
189%
CONTACT
Samuel Burgess
samuel.burge[email protected]
Neil Christy
neil.christy@milliman.com
Isabel Stansfield
isabel.stansfield@milliman.com

MILLIMAN RESEARCH REPORT
Analysis of life insurers’ solvency and 45 September 2023
financial condition reports year-end 2022
Appendix 1: UK life companies included in the analysis
1. abrdn Life and Pensions Limited
2. AEGON Scottish Equitable
3. Aviva International Insurance
4. Aviva Investors Pensions
5. Aviva Life & Pensions UK
6. BlackRock Life
7. Canada Life
8. CASLP
9. Chubb Life Europe
10. Churchill Insurance Company
11. Countrywide Assured
12. Covéa Life
13. Dentists’ Provident Society
14. Ecclesiastical Life
15. Exeter Friendly Society
16. Family Assurance Friendly Society
17. FIL Life Insurance
18. Forester Life
19. Holloway Friendly
20. HSBC Life (UK)
21. Independent Order of Odd Fellows Manchester
Unity Friendly Society
22. IntegraLife UK
23. Just Retirement
24. Legal & General Assurance
(Pensions Management)
25. Legal & General Assurance Society
26. Liverpool Victoria Financial Services
27. Liverpool Victoria Life Company
28. London General Life Company
29. Metropolitan Police Friendly Society
30. Mobius Life
31. National Deposit Friendly Society
32. Omnilife Insurance Company
33. Partnership Life Assurance Company
34. Pension Insurance Corporation
35. Phoenix Life
36. Phoenix Life Assurance
37. Prudential Pensions
38. Quilter Life & Pensions
39. Railway Enginemen’s Assurance Society
40. ReAssure
41. ReAssure Life
42. Rothesay Life
43. Schroder Pensions Management
44. Scottish Friendly Assurance Society
45. Scottish Widows
46. Sheffield Mutual Friendly Society
47. St James’s Place UK
48. Standard Life Assurance
49. Standard Life Pension Funds
50. Suffolk Life Annuities
51. Sun Life Assurance Company of Canada (UK)
52. The Ancient Order of Foresters Friendly Society
53. The National Farmers Union Mutual
Insurance Society
54. The Prudential Assurance Company
55. The Rechabite Friendly Society
56. The Royal London Mutual Insurance Society
57. The Shepherds Friendly Society
58. Threadneedle Pensions
59. Trafalgar Insurance
60. Transport Friendly Society
61. UBS Asset Management Life
62. Unum
63. Utmost Life & Pensions
64. Vitality Life
65. Wesleyan Assurance
66. Zurich Assurance
© 2023 Milliman, Inc. All Rights Reserved. The materials in this document represent the opinion of the authors and are not representative of the views of Milliman, Inc. Milliman
does not certify the information, nor does it guarantee the accuracy and completeness of such information. Use of such information is voluntary and should not be relied upon
unless an independent review of its accuracy and completeness has been performed. Materials may not be reproduced without the express consent of Milliman.
